

703 grants from NEA totaling $34,216,752
191 grants from NEH totaling $24,842,706
231 grants from IMLS totaling $41,405,420
Geographic Reach
962 grants to 212 metropolitan areas
83 grants to 51 micropolitan areas
80 grants to 56 rural areas
Population insights
Total region population – 79,587,339
In 2023, the average Federal cultural investment was $4.98 per person in the Western region.
Creative West’s Congressional Districts
In 2023, the three cultural agencies awarded grants in 98% of the US Congressional Districts (102 of 104 districts) and in 100% of the US Territories (3 of 3 territories) in the Western region.
651 grants from NEA totaling $36,032,460
182 grants from NEH totaling $22,713,793
220 grants from IMLS totaling $67,938,394
Geographic Reach
893 grants to 182 metropolitan areas
91 grants to 52 micropolitan areas
69 grants to 55 rural areas
Population insights
Total region population – 80,283,666
In 2024, the average Federal cultural investment was $3.96 per person in the Western region.
Creative West’s Congressional Districts
In 2024, the three cultural agencies awarded grants in 93% of the US Congressional Districts (97 of 104 districts) and in 100% of the US Territories (3 of 3 territories) in the Western region.
302 grants from NEA totaling $26,676,938
307 grants from NEH totaling $41,697,983
166 grants from IMLS totaling $53,592,739
Geographic Reach
591 grants to 147 metropolitan areas
63 grants to 32 micropolitan areas
121 grants to 121 rural areas
Population Insights
Total region population – 80,404,723
In 2025, the Federal cultural investment was $1.52 per person.
Creative West’s Congressional Districts
In 2025, the three agencies (NEA, NEH and IMLS) awarded grants in 89% of the US Congressional Districts (93 of 104) and in 100% of the US Territories (3 of 3) in the Western Region.
If you would like a detailed list of grants by district, please email keren@usregionalarts.org
382 grants from NEA totaling $11,093,733
76 grants from NEH totaling $10,266,302
75 grants from IMLS totaling $9,997,454
Geographic Reach
512 grants to 111 metropolitan areas
16 grants to 13 micropolitan areas
5 grants to 5 rural areas
Population Insights
Total state population – 39,198,693
In 2023, the Federal cultural investment was $.80 per person.
California Congressional Districts
In 2023-2024, the three agencies (NEA, NEH and IMLS) awarded grants in 100% of the US Congressional Districts (52 of 52 districts) in California.
If you would like a detailed list of grants awarded by district, please email keren@usregionalarts.org.
344 grants from NEA totaling $11,938,171
81 grants from NEH totaling $10,913,754
64 grants from IMLS totaling $26,400,893
Geographic Reach
473 grants to 95 metropolitan areas
14 grants to 10 micropolitan areas
2 grants to 2 rural areas
Population Insights
Total state population – 39,431,263
In 2024, the Federal cultural investment was $1.25 per person.
California Congressional Districts
In 2023-2024, the three agencies (NEA, NEH and IMLS) awarded grants in 100% of the US Congressional Districts (52 of 52 districts) in California.
If you would like a detailed list of grants awarded by district, please email keren@usregionalarts.org.
141 grants from NEA totaling $5,660,756
136 grants from NEH totaling $18,966,636
31 grants from IMLS totaling $17,748,366
Geographic Reach
289 grants to 79 metropolitan areas
7 grants to 2 micropolitan areas
12 grants to 34 rural areas
Population Insights
Total state population – 39,355,309
In 2025, the Federal cultural investment was $1.08 per person.
California Congressional Districts
In 2025, the three agencies (NEA, NEH and IMLS) awarded grants in 85% of the US Congressional Districts (44 of 52) in California.
If you would like a detailed list of grants by district, please email keren@usregionalarts.org.
38 grants from NEA totaling $1,831,100
18 grants from NEH totaling $1,893,316
3 grants from IMLS totaling $454,511
Geographic Reach
56 grants to 9 metropolitan areas
2 grants to 2 micropolitan areas
1 grants to 1 rural area
Population Insights
Total state population – 4,253,653
In 2023, the Federal cultural investment was $0.98 per person.
Oregon Congressional Districts
In 2023-2024, the three agencies (NEA, NEH and IMLS) awarded grants in 100% of the US Congressional Districts (6 of 6 districts) in Oregon
If you would like a detailed list of grants awarded by district, please email keren@usregionalarts.org.
35 grants from NEA totaling $1,995,100
10 grants from NEH totaling $1,513,865
6 grants from IMLS totaling $3,594,966
Geographic Reach
47 grants to 5 metropolitan areas
4 grants to 4 micropolitan areas
Population Insights
Total state population – 4,272,371
In 2024, the Federal cultural investment was $1.66 per person.
Oregon Congressional Districts
In 2023-2024, the three agencies (NEA, NEH and IMLS) awarded grants in 100% of the US Congressional Districts (6 of 6 districts) in Oregon.
If you would like a detailed list of grants awarded by district, please email keren@usregionalarts.org.
17 grants from NEA totaling $1,634,438
19 grants from NEH totaling $3,384,937
3 grants from IMLS totaling $3,086,181
Geographic Reach
33 grants to 6 metropolitan areas
3 grants to 3 micropolitan areas
3 grants to 3 rural areas
Population Insights
Total state population – 4,273,586
In 2025, the Federal cultural investment was $1.90 per person.
Oregon Congressional Districts
In 2025, the three agencies (NEA, NEH and IMLS) awarded grants in 100% of the US Congressional Districts (6 of 6) in Oregon.
If you would like a detailed list of grants by district, please email keren@usregionalarts.org.
75 grants from NEA totaling $3,124,377
15 grants from NEH totaling $3,397,286
27 grants from IMLS totaling $6,509,063
Geographic Reach
100 grants to 20 metropolitan areas
12 grants to 7 micropolitan areas
5 grants to 5 rural areas
Population Insights
Total state population – 7,857,320
In 2023, the Federal cultural investment was $1.66 per person.
Washington Congressional Districts
In 2023-2024, the three agencies (NEA, NEH and IMLS) awarded grants in 90% of the US Congressional Districts (9 of 10 districts) in Washington.
If you would like a detailed list of grants awarded by district, please email keren@usregionalarts.org.
64 grants from NEA totaling $3,098,400
12 grants from NEH totaling $1,047,590
31 grants from IMLS totaling $8,198,984
Geographic Reach
92 grants to 20 metropolitan areas
11 grants to 6 micropolitan areas
4 grants to 4 rural areas
Population Insights
Total state population – 7,958,180
In 2024, the Federal cultural investment was $1.55 per person.
Washington Congressional Districts
In 2023-2024, the three agencies (NEA, NEH and IMLS) awarded grants in 90% of the US Congressional Districts (9 of 10 districts) in Washington.
If you would like a detailed list of grants awarded by district, please email keren@usregionalarts.org.
26 grants from NEA totaling $1,969,815
27 grants from NEH totaling $4,023,283
15 grants from IMLS totaling $4,409,338
Geographic Reach
50 grants to 14 metropolitan areas
8 grants to 7 micropolitan areas
10 grants to 10 rural areas
Population Insights
Total state population – 8,001,020
In 2025, the Federal cultural investment was $1.30 per person.
Washington Congressional Districts
In 2025, the three agencies (NEA, NEH and IMLS) awarded grants in 90% of the US Congressional Districts (9 of 10) in Washington.
If you would like a detailed list of grants by district, please email keren@usregionalarts.org.
7 grants from NEA totaling $1,202,155
4 grants from NEH totaling $103,056
4 grants from IMLS totaling $178,098
Geographic Reach
13 grants to 3 metropolitan areas
2 grants to 2 micropolitan areas
Population Insights
Total population – 1,971,122
In 2023, the Federal cultural investment was $0.75 per person.
Idaho Congressional Districts
In 2023-2024, the three agencies (NEA, NEH, and IMLS) awarded grants in 100% of the US Congressional Districts (2 of 2 districts) in Idaho.
If you would like a detailed list of grants awarded by district, please email keren@usregionalarts.org.
10 grants from NEA totaling $1,146,950
3 grants from NEH totaling $589,053
4 grants from IMLS totaling $1,786,845
Geographic Reach
12 grants to 2 metropolitan areas
3 grants to 1 micropolitan area
2 grants to 2 rural areas
Population Insights
Total state population – 2,001,619
In 2024, the Federal cultural investment was $1.76 per person.
Idaho Congressional Districts
In 2023-2024, the three agencies (NEA, NEH and IMLS) awarded grants in 100% of the US Congressional Districts (2 of 2 districts) in Idaho.
If you would like a detailed list of grants awarded by district, please email keren@usregionalarts.org.
4 grants from NEA totaling $1,067,778
3 grants from NEH totaling $616,344
7 grants from IMLS totaling $2,155,236
Geographic Reach
6 grants to 2 metropolitan areas
5 grants to 2 micropolitan areas
3 grants to 2 rural areas
Population Insights
Total state population – 2,029,733
In 2025, the Federal cultural investment was $1.89 per person.
Idaho Congressional Districts
In 2025, the three agencies (NEA, NEH and IMLS) awarded grants in 100% of the US Congressional Districts (2 of 2) in Idaho.
If you would like a detailed list of grants by district, please email keren@usregionalarts.org.
12 grants from NEA totaling $1,114,950
6 grants from NEH totaling $161,139
5 grants from IMLS totaling $632,679
Geographic Reach
18 grants to 5 metropolitan areas
3 grants to 3 micropolitan areas
2 grants to 2 rural areas
Population Insights
Total population – 2,121,164
In 2023, the Federal cultural investment was $0.91 per person.
Nevada Congressional Districts
In 2023-2024, the three agencies (NEA, NEH and IMLS) awarded grants in 100% of the US Congressional Districts (4 of 4 districts) in Nevada.
If you would like a detailed list of grants awarded by district, please email keren@usregionalarts.org.
8 grants from NEA totaling $1,069,200
5 grants from NEH totaling $269,999
5 grants from IMLS totaling $2,756,920
Geographic Reach
14 grants to 5 metropolitan areas
3 grants to 2 micropolitan areas
1 grant to 1 rural area
Population Insights
Total state population – 2,130,256
In 2024, the Federal cultural investment was $1.92 per person.
Nevada Congressional Districts
In 2023-2024, the three agencies (NEA, NEH and IMLS) awarded grants in 100% of the US Congressional Districts (4 of 4 districts) in Nevada.
If you would like a detailed list of grants awarded by district, please email keren@usregionalarts.org.
In 2025, the three cultural agencies awarded 14 grants in Nevada, investing $3,917,329 in the state.
4 grants from NEA totaling $1,125,838
8 grants from NEH totaling $562,999
2 grants from IMLS totaling $2,228,492
Geographic Reach
13 grants to 3 metropolitan areas
1 grant to 1 rural area
Population Insights
Total state population – 3,282,188
In 2025, the Federal cultural investment was $1.19 per person.
Nevada Congressional Districts
In 2025, the three agencies (NEA, NEH and IMLS) awarded grants in 75% of the US Congressional Districts (3 of 4) in Nevada.
If you would like a detailed list of grants by district, please email keren@usregionalarts.org.
50 grants from NEA totaling $4,764,204
14 grants from NEH totaling $1,125,126
7 grants from IMLS totaling $4,055,034
Geographic Reach
61 grants to 16 metropolitan areas
5 grants to 3 micropolitan areas
5 grants to 5 rural areas
Population Insights
Total state population – 5,901,339
In 2023, the Federal cultural investment was $1.69 per person.
Colorado Congressional Districts
In 2023-2024, the three agencies (NEA, NEH, and IMLS) awarded grants in 100% of the US Congressional Districts (8 of 8 districts) in Colorado.
If you would like a detailed list of grants awarded by district, please email keren@usregionalarts.org.
35 grants from NEA totaling $4,310,496
10 grants from NEH totaling $1,165,031
10 grants from IMLS totaling $4,291,153
Geographic Reach
47 grants to 12 metropolitan areas
6 grants to 4 micropolitan areas
2 grants to 2 rural areas
Population Insights
Total state population – 5,957,493
In 2024, the Federal cultural investment was $1.64 per person.
Colorado Congressional Districts
In 2023-2024, the three agencies (NEA, NEH and IMLS) awarded grants in 100% of the US Congressional Districts (8 of 8 districts) in Colorado.
If you would like a detailed list of grants awarded by district, please email keren@usregionalarts.org.
20 grants from NEA totaling $4,097,564
18 grants from NEH totaling $2,273,185
3 grants from IMLS totaling $3,571,628
Geographic Reach
35 grants to 8 metropolitan areas
4 grants to 4 micropolitan areas
2 grants to 2 rural areas
Population Insights
Total state population – 6,012,561
In 2025, the Federal cultural investment was $1.65 per person.
Colorado Congressional Districts
In 2025, the three agencies (NEA, NEH and IMLS) awarded grants in 100% of the US Congressional Districts (8 of 8) in Colorado.
If you would like a detailed list of grants by district, please email keren@usregionalarts.org.
8 grants from NEA totaling $1,009,978
6 grants from NEH totaling $656,709
5 grants from IMLS totaling $864,024
Geographic Reach
3 grants to 2 metropolitan areas
15 grants to 7 micropolitan areas
1 grant to 1 rural area
Population Insights
Total district population – 585,067
In 2023, the Federal cultural investment was $4.33 per person.
Wyoming Congressional Districts
In 2023-2024, the three agencies (NEA, NEH and IMLS) awarded grants in 100% of the US Congressional Districts (1 of 1 district) in Wyoming.
If you would like a detailed list of grants awarded by district, please email keren@usregionalarts.org.
7 grants from NEA totaling $1,139,773
1 grant from NEH totaling $593,053
2 grants from IMLS totaling $1,230,427
Geographic Reach
3 grants to 2 metropolitan areas
7 grants to 4 micropolitan areas
Population Insights
Total state population – 587,618
In 2024, the Federal cultural investment was $5.04 per person.
Wyoming Congressional Districts
In 2023-2024, the three agencies (NEA, NEH and IMLS) awarded grants in 100% of the US Congressional Districts (1 of 1 district) in Wyoming.
If you would like a detailed list of grants awarded by district, please email keren@usregionalarts.org.
6 grants from NEA totaling $1,091,521
5 grants from NEH totaling $568,594
3 grants from IMLS totaling $1,479,133
Geographic Reach
3 grants to 1 metropolitan area
5 grants to 2 micropolitan areas
6 grants to 5 rural areas
Population Insights
Total state population – 588,753
In 2025, the Federal cultural investment was $5.33 per person.
Wyoming Congressional Districts
In 2025, the three agencies (NEA, NEH and IMLS) awarded grants in 100% of the US Congressional Districts (1 of 1) in Wyoming.
If you would like a detailed list of grants by district, please email keren@usregionalarts.org.
25 grants from NEA totaling $1,579,500
6 grants from NEH totaling $748,503
6 grants from IMLS totaling $3,340,541
Geographic Reach
29 grants to 5 metropolitan areas
4 grants to 2 micropolitan areas
4 grants to 2 rural areas
Population Insights
Total state population – 3,443,222
In 2023, the Federal cultural investment was $1.65 per person.
Utah Congressional Districts
In 2023-2024, the three agencies (NEA, NEH and IMLS) awarded grants in 100% of the US Congressional Districts (4 of 4 districts) in Utah.
If you would like a detailed list of grants awarded by district, please email keren@usregionalarts.org.
21 grants from NEA totaling $1,644,500
4 grants from NEH totaling $533,966
1 grant from IMLS totaling $2,289,874
Geographic Reach
19 grants to 2 metropolitan areas
5 grants to 2 micropolitan areas
2 grants to 1 rural area
Population Insights
Total state population – 3,503,613
In 2024, the Federal cultural investment was $1.28 per person.
Utah Congressional Districts
In 2023-2024, the three agencies (NEA, NEH and IMLS) awarded grants in 100% of the US Congressional Districts (4 of 4 districts) in Utah.
If you would like a detailed list of grants awarded by district, please email keren@usregionalarts.org.
11 grants from NEA totaling $1,307,738
9 grants from NEH totaling $1,599,015
3 grants from IMLS totaling $2,405,831
Geographic Reach
16 grants to 5 metropolitan areas
5 grants to 3 micropolitan areas
2 grants to 1 rural area
Population Insights
Total state population – 3,538,904
In 2025, the Federal cultural investment was $1.50 per person.
Utah Congressional Districts
In 2025, the three agencies (NEA, NEH and IMLS) awarded grants in 75% of the US Congressional Districts (3 of 4) in Utah.
If you would like a detailed list of grants by district, please email keren@usregionalarts.org.
35 grants from NEA totaling $1,786,100
10 grants from NEH totaling $1,905,895
13 grants from IMLS totaling $3,027,105
Geographic Reach
48 grants to 8 metropolitan areas
8 grants to 4 micropolitan areas
2 grants to 2 rural areas
Population Insights
Total state population – 3,214,363
In 2023, the Federal cultural investment was $2.09 per person.
New Mexico Congressional Districts
In 2023-2024, the three agencies (NEA, NEH and IMLS) awarded grants in 100% of the US Congressional Districts (3 of 3 districts) in New Mexico.
If you would like a detailed list of grants awarded by district, please email keren@usregionalarts.org.
42 grants from NEA totaling $2,008,102
9 grants from NEH totaling $731,000
13 grants from IMLS totaling $2,906,614
Geographic Reach
54 grants to 9 metropolitan areas
9 grants to 7 micropolitan areas
1 grant to 1 rural area
Population Insights
Total state population – 3,267,467
In 2024, the Federal cultural investment was $1.73 per person.
New Mexico Congressional Districts
In 2023-2024, the three agencies (NEA, NEH and IMLS) awarded grants in 100% of the US Congressional Districts (3 of 3 districts) in New Mexico.
If you would like a detailed list of grants awarded by district, please email keren@usregionalarts.org.
13 grants from NEA totaling $1,438,160
15 grants from NEH totaling $1,581,502
13 grants from IMLS totaling $2,472,720
Geographic Reach
28 grants to 6 metropolitan areas
7 grants to 5 micropolitan areas
6 grants to 6 rural areas
Population Insights
Total state population – 2,125,498
In 2025, the Federal cultural investment was $2.58 per person.
New Mexico Congressional Districts
In 2025, the three agencies (NEA, NEH and IMLS) awarded grants in 100% of the US Congressional Districts (3 of 3) in New Mexico.
If you would like a detailed list of grants by district, please email keren@usregionalarts.org.
30 grants from NEA totaling $1,853,337
13 grants from NEH totaling $1,535,137
15 grants from IMLS totaling $5,735,843
Geographic Reach
56 grants to 14 metropolitan areas
2 grants to 2 micropolitan areas
Population Insights
Total state population – 7,473,027
In 2023, the Federal cultural investment was $1.22 per person.
Arizona Congressional Districts
In 2023-2024, the three agencies (NEA, NEH and IMLS) awarded grants in 89% of the US Congressional Districts (8 of 9 districts) in Arizona.
If you would like a detailed list of grants awarded by district, please email keren@usregionalarts.org.
33 grants from NEA totaling $2,187,671
19 grants from NEH totaling $2,543,725
15 grants from IMLS totaling $5,119,388
Geographic Reach
63 grants to 17 metropolitan areas
3 grants to 3 micropolitan areas
1 grant to 1 rural area
Population Insights
Total state population – 7,582,384
In 2024, the Federal cultural investment was $1.30 per person.
Arizona Congressional Districts
In 2023-2024, the three agencies (NEA, NEH and IMLS) awarded grants in 89% of the US Congressional Districts (8 of 9 districts) in Arizona.
If you would like a detailed list of grants awarded by district, please email keren@usregionalarts.org.
25 grants from NEA totaling $2,052,014
28 grants from NEH totaling $3,264,958
12 grants from IMLS totaling $4,647,088
Geographic Reach
57 grants to 11 metropolitan areas
8 grants to 7 rural areas
Population Insights
Total state population – 7,623,818
In 2025, the Federal cultural investment was $1.30 per person.
Arizona Congressional Districts
In 2025, the three agencies (NEA, NEH and IMLS) awarded grants in 100% of the US Congressional Districts (9 of 9) in Arizona.
If you would like a detailed list of grants by district, please email keren@usregionalarts.org.
17 grants from NEA totaling $1,459,396
3 grants from NEH totaling $222,060
7 grants from IMLS totaling $2,091,605
Geographic Reach
20 grants to 5 metropolitan areas
2 grants to 2 micropolitan areas
5 grants to 4 rural areas
Population Insights
Total state population – 1,131,302
In 2023, the Federal cultural investment was $3.34 per person.
Montana Congressional Districts
In 2023-2024, the three agencies (NEA, NEH and IMLS) awarded grants in 100% of the US Congressional Districts (2 of 2 districts) in Montana.
If you would like a detailed list of grants awarded by district, please email keren@usregionalarts.org.
15 grants from NEA totaling $1,455,400
1 grant from NEH totaling $6,000
7 grants from IMLS totaling $2,203,146
Geographic Reach
18 grants to 4 metropolitan areas
2 grants to 2 micropolitan areas
3 grants to 3 rural areas
Population Insights
Total state population – 1,137,233
In 2024, the Federal cultural investment was $3.22 per person.
Montana Congressional Districts
In 2023-2024, the three agencies (NEA, NEH and IMLS) awarded grants in 100% of the US Congressional Districts (2 of 2 districts) in Montana.
If you would like a detailed list of grants awarded by district, please email keren@usregionalarts.org.
13 grants from NEA totaling $1,560,138
3 grants from NEH totaling $556,000
6 grants from IMLS totaling $1,794,249
Geographic Reach
15 grants to 4 metropolitan areas
7 grants to 6 rural areas
Population Insights
Total state population – 1,144,694
In 2025, the Federal cultural investment was $3.42 per person.
Montana Congressional Districts
In 2025, the three agencies (NEA, NEH and IMLS) awarded grants in 100% of the US Congressional Districts (2 of 2) in Montana.
If you would like a detailed list of grants by district, please email keren@usregionalarts.org.
10 grants from NEA totaling $1,282,200
7 grants from NEH totaling $734,071
16 grants from IMLS totaling $2,224,856
Geographic Reach
32 grants to 10 metropolitan areas
1 grant to 1 micropolitan area
Population Insights
Total state population – 1,441,387
In 2023, the Federal cultural investment was $2.94 per person.
Hawai‘i Congressional Districts
In 2023-2024, the three agencies (NEA, NEH and IMLS) awarded grants in 100% of the US Congressional Districts (1 of 1 districts) in Hawaii.
If you would like a detailed list of grants awarded by district, please email keren@usregionalarts.org.
19 grants from NEA totaling $1,533,500
14 grants from NEH totaling $1,479,076
11 grants from IMLS totaling $3,210,943
Geographic Reach
37 grants to 8 metropolitan areas
7 grants to 4 micropolitan areas
Population Insights
Total state population – 1,446,146
In 2024, the Federal cultural investment was $4.30 per person.
Hawai‘i Congressional Districts
In 2023-2024, the three agencies (NEA, NEH and IMLS) awarded grants in 100% of the US Congressional Districts (1 of 1 districts) in Hawaii.
If you would like a detailed list of grants awarded by district, please email keren@usregionalarts.org.
12 grants from NEA totaling $1,339,738
18 grants from NEH totaling $1,607,720
4 grants from IMLS totaling $2,039,292
Geographic Reach
28 grants to 6 metropolitan areas
1 grant to 1 micropolitan area
5 grants to 5 rural areas
Population Insights
Total state population – 1,432,820
In 2025, the Federal cultural investment was $3.48 per person.
Hawai‘i Congressional Districts
In 2025, the three agencies (NEA, NEH and IMLS) awarded grants in 100% of the US Congressional Districts (2 of 2) in Hawaii.
If you would like a detailed list of grants by district, please email keren@usregionalarts.org.
1 grant from NEA totaling $350,800
2 grants from NEH totaling $275,482
1 grant from IMLS totaling $119,589
Geographic Reach
4 grants to 1 rural area
Population Insights
Total population – 45,143
In 2023, the Federal cultural investment was $16.52 per person.
Marianas Islands Representation
In 2023-2024, the three agencies (NEA, NEH and IMLS) awarded grants in the US territory of the Marianas Islands, represented by a non-voting delegate.
If you would like a detailed list of grants awarded to this territory, please email keren@usregionalarts.org.
1 grant from NEA totaling $350,800
1 grant from NEH totaling $149,998
1 grant from IMLS totaling $119,292
Geographic Reach
3 grants to 1 rural area
Population Insights
Total population – 50,255
In 2024, the Federal cultural investment was $12.34 per person.
Marianas Islands Representation
In 2023-2024, the three agencies (NEA, NEH and IMLS) awarded grants in the US territory of the Marianas Islands, represented by a non-voting delegate.
If you would like a detailed list of grants awarded to this territory, please email keren@usregionalarts.org.
1 grant from NEA totaling $376,100
1 grant from NEH totaling $149,998
2 grants from IMLS totaling $218,999
Geographic Reach
4 grants to 1 micropolitan area
Population Insights
Total territory population – 43,541
In 2025, the Federal cultural investment was $17.11 per person.
Marianas Islands Representation
In 2025, the three agencies (NEA, NEH and IMLS) awarded grants in the US territory of the Marianas Islands, represented by a non-voting delegate.
If you would like a detailed list of grants for this territory, please email keren@usregionalarts.org.
1 grant from NEA totaling $373,695
4 grants from NEH totaling $971,058
1 grant from IMLS totaling $117,040
Geographic Reach
6 grants to 1 rural area
Population Insights
Total population – 47,521
In 2023, the Federal cultural investment was $30.76 per person.
American Samoa Representation
In 2023-2024, the three agencies (NEA, NEH, and IMLS) awarded grants in the US territory of America Samoa, represented by a non-voting delegate.
If you would like a detailed list of grants awarded to this territory, please email keren@usregionalarts.org.
1 grant from NEA totaling $378,650
1 grant from IMLS totaling $116,566
Geographic Reach
2 grants to 1 rural area
Population Insights
Total population – 43,521
In 2024, the Federal cultural investment was $11.38 per person.
American Samoa Representation
In 2023-2024, two of the three agencies (NEA, NEH and IMLS) awarded grants in the US territory of American Samoa, represented by a non-voting delegate.
If you would like a detailed list of grants awarded to this territory, please email keren@usregionalarts.org.
1 grant from NEA totaling $404200
2 grants from NEH totaling $1,108,136
1 grant from IMLS totaling $116,135
Geographic Reach
4 grants to 1 rural area
Population Insights
Total territory population – 46,029
In 2025, the Federal cultural investment was $35.38 per person.
American Samoa Representation
In 2025, the three agencies (NEA, NEH and IMLS) awarded grants in the US territory of American Samoa, represented by a non-voting delegate.
If you would like a detailed list of grants for this territory, please email keren@usregionalarts.org.
1 grant from NEA totaling $378,700
2 grants from NEH totaling $275,878
1 grant from IMLS totaling $164,666
Geographic Reach
4 grants to 1 rural area
Population Insights
Total population – 166,506
In 2023, the Federal cultural investment was $4.92 per person.
Guam Representation
In 2023-2024, the three agencies (NEA, NEH, and IMLS) awarded grants in the US territory of Guam, represented by a non-voting delegate.
If you would like a detailed list of grants awarded to this territory, please email keren@usregionalarts.org.
1 grant from NEA totaling $376,950
3 grants from NEH totaling $358,376
1 grant from IMLS totaling $163,982
Geographic Reach
1 grant to 1 micropolitan area
4 grants to 1 rural area
Population Insights
Total population – 174,114
In 2024, the Federal cultural investment was $5.17 per person.
Guam Representation
In 2023-2024, the three agencies (NEA, NEH and IMLS) awarded grants in the US territory of Guam, represented by a non-voting delegate.
If you would like a detailed list of grants awarded to this territory, please email keren@usregionalarts.org.
2 grants from NEA totaling $422,115
4 grants from NEH totaling $496,971
1 grant from IMLS totaling $163,281
Geographic Reach
7 grants to 3 rural areas
Population Insights
Total state population – 168,999
In 2025, the Federal cultural investment was $6.40 per person.
Guam Representation
In 2025, the three agencies (NEA, NEH and IMLS) awarded grants in the US territory of Guam, represented by a non-voting delegate.
If you would like a detailed list of grants for this territory, please email keren@usregionalarts.org.
11 grants from NEA totaling $981,527
5 grants from NEH totaling $571,688
45 grants from IMLS totaling $1,893,312
Geographic Reach
14 grants to 4 metropolitan areas
11 grants to 3 micropolitan areas
36 grants to 26 rural areas
Population Insights
Total state population – 736,510
In 2023, the Federal cultural investment was $4.68 per person.
Alaska Congressional Districts
In 2023-2024, the three agencies (NEA, NEH, and IMLS) awarded grants in 100% of the US Congressional Districts (1 of 1 district) in Alaska
If you would like a detailed list of grants awarded by district, please email keren@usregionalarts.org.
15 grants from NEA totaling $1,398,797
9 grants from NEH totaling $819,307
48 grants from IMLS totaling $3,548,401
Geographic Reach
14 grants to 1 metropolitan area
16 grants to 2 micropolitan areas
42 grants to 35 rural areas
Population Insights
Total state population – 740,133
In 2024, the Federal cultural investment was $7.79 per person.
Alaska Congressional Districts
In 2023-2024, the three agencies (NEA, NEH and IMLS) awarded grants in 100% of the US Congressional Districts (1 of 1 district) in Alaska.
If you would like a detailed list of grants awarded by district, please email keren@usregionalarts.org.
6 grants from NEA totaling $1,129,025
11 grants from NEH totaling $937,705
60 grants from IMLS totaling $5,056,770
Geographic Reach
18 grants to 2 metropolitan areas
14 grants to 2 micropolitan areas
45 grants to 35 rural areas
Population Insights
Total state population – 737,270
In 2025, the Federal cultural investment was $9.66 per person.
Alaska Congressional Districts
In 2025, the three agencies (NEA, NEH and IMLS) awarded grants in 100% of the US Congressional Districts (1 of 1) in Alaska.
If you would like a detailed list of grants by district, please email keren@usregionalarts.org.

214 grants from NEA totaling $12,932,966
68 grants from NEH totaling $6,972,361
61 grants from IMLS totaling $17,926,065
Geographic Reach
299 grants to 62 metropolitan areas
31 grants to 17 micropolitan areas
13 grants to 11 rural areas
Population insights
Total region population – 49,008,637
In 2023, the average Federal cultural investment was $1.24 per person in the mid-America region.
M-AAA’s Congressional Districts
In 2023, the three cultural agencies awarded grants in 85% of the US Congressional Districts (53 of 62 districts) in the mid-America region.
198 grants from NEA totaling $12,973,266
59 grants from NEH totaling $6,292,678
59 grants from IMLS totaling $31,161,925
Geographic Reach
281 grants to 57 metropolitan areas
17 grants to 12 micropolitan areas
15 grants to 13 rural areas
Population insights
Total region population – 49,696,115
In 2024, the average Federal cultural investment was $1.44 per person in the mid-America region.
M-AAA’s Congressional Districts
In 2024, the three cultural agencies awarded grants in 84% of the US Congressional Districts (52 of 62 districts) in the mid-America region.
102 grants from NEA totaling $11,000,296
115 grants from NEH totaling $232,875
57 grants from IMLS totaling $32,531,332
Geographic Reach
234 grants to 58 metropolitan areas
15 grants to 10 micropolitan areas
25 grants to 16 rural areas
Population Insights
Total region population – 50,213,667
In 2025, the Federal cultural investment was $0.87 per person.
M-AAA’s Congressional Districts
In 2025, the three agencies (NEA, NEH and IMLS) awarded grants in 82% of the US Congressional Districts (51 of 62) in the Mid-America region.
If you would like a detailed list of grants by district, please email keren@usregionalarts.org
116 grants from NEA totaling $4,372,119
33 grants from NEH totaling $3,537,014
15 grants from IMLS totaling $4,174,471
Geographic Reach
162 grants to 33 metropolitan areas
2 grants to 2 rural areas
Population Insights
Total state population – 30,727,890
In 2023, the Federal cultural investment was $0.39 per person.
Texas Congressional Districts
In 2023-2024, the three agencies (NEA, NEH and IMLS) awarded grants in 84% of the US Congressional Districts (32 of 38 districts) in Texas.
If you would like a detailed list of grants awarded by district, please email keren@usregionalarts.org.
103 grants from NEA totaling $4,153,600
35 grants from NEH totaling $2,427,993
20 grants from IMLS totaling $15,468,505
Geographic Reach
156 grants to 32 metropolitan areas
2 grants to 2 rural areas
Population Insights
Total state population – 31,290,831
In 2024, the Federal cultural investment was $0.70 per person.
Texas Congressional Districts
In 2023-2024, the three agencies (NEA, NEH and IMLS) awarded grants in 84% of the US Congressional Districts (32 of 38 districts) in Texas.
If you would like a detailed list of grants awarded by district, please email keren@usregionalarts.org.
56 grants from NEA totaling $3,076,287
69 grants from NEH totaling $139,725
10 grants from IMLS totaling $15,404,020
Geographic Reach
130 grants to 31 metropolitan areas
1 grant to 1 micropolitan area
4 grants to 2 rural areas
Population Insights
Total state population – 31,709,821
In 2025, the Federal cultural investment was $0.59 per person.
Texas Congressional Districts
In 2025, the three agencies (NEA, NEH and IMLS) awarded grants in 79% of the US Congressional Districts (30 of 38) in Texas.
If you would like a detailed list of grants by district, please email keren@usregionalarts.org.
10 grants from NEA totaling $1,197,100
9 grants from NEH totaling $703,368
30 grants from IMLS totaling $4,269,760
Geographic Reach
22 grants to 8 metropolitan areas
25 grants to 12 micropolitan areas
2 grants to 2 rural areas
Population Insights
Total state population – 4,063,882
In 2023, the Federal cultural investment was $1.52 per person.
Oklahoma Congressional Districts
In 2023-2024, the three agencies (NEA, NEH and IMLS) awarded grants in 100% of the US Congressional Districts (5 of 5 districts) in Oklahoma.
If you would like a detailed list of grants awarded by district, please email keren@usregionalarts.org.
12 grants from NEA totaling $1,257,100
5 grants from NEH totaling $1,248,407
20 grants from IMLS totaling $4,375,334
Geographic Reach
21 grants to 4 metropolitan areas
13 grants to 8 micropolitan areas
3 grants to 3 rural areas
Population Insights
Total state population – 4,095,393
In 2024, the Federal cultural investment was $1.68 per person.
Oklahoma Congressional Districts
In 2023-2024, the three agencies (NEA, NEH and IMLS) awarded grants in 100% of the US Congressional Districts (5 of 5 districts) in Oklahoma.
If you would like a detailed list of grants awarded by district, please email keren@usregionalarts.org.
6 grants from NEA totaling $1,193,938
12 grants from NEH totaling $24,300
28 grants from IMLS totaling $4,068,120
Geographic Reach
20 grants to 7 metropolitan areas
12 grants to 7 micropolitan areas
14 grants to 8 rural areas
Population Insights
Total state population – 4,123,288
In 2025, the Federal cultural investment was $1.28 per person.
Oklahoma Congressional Districts
In 2025, the three agencies (NEA, NEH and IMLS) awarded grants in 100% of the US Congressional Districts (5 of 5) in Oklahoma.
If you would like a detailed list of grants by district, please email keren@usregionalarts.org.
12 grants from NEA totaling $1,063,800
5 grants from NEH totaling $785,993
1 grant from IMLS totaling $2,163,113
Geographic Reach
13 grants to 5 metropolitan areas
5 grants to 4 rural areas
Population Insights
Total state population – 3,069,463
In 2023, the Federal cultural investment was $1.31 per person.
Arkansas Congressional Districts
In 2023-2024, the three agencies (NEA, NEH and IMLS) awarded grants in 100% of the US Congressional Districts (4 of 4 districts) in Arkansas.
If you would like a detailed list of grants awarded by district, please email keren@usregionalarts.org.
17 grants from NEA totaling $1,329,025
4 grants from NEH totaling $515,193
2 grants from IMLS totaling $2,204,045
Geographic Reach
21 grants to 6 metropolitan areas
2 grants to 2 rural areas
Population Insights
Total state population – 3,088,354
In 2024, the Federal cultural investment was $1.31 per person.
Arkansas Congressional Districts
In 2023-2024, the three agencies (NEA, NEH and IMLS) awarded grants in 100% of the US Congressional Districts (4 of 4 districts) in Arkansas.
If you would like a detailed list of grants awarded by district, please email keren@usregionalarts.org.
6 grants from NEA totaling $991,983
6 grants from NEH totaling $12,150
3 grants from IMLS totaling $2,819,380
Geographic Reach
13 grants to 5 metropolitan areas
1 grant to 1 micropolitan area
1 grant to 1 rural area
Population Insights
Total state population – 3,114,791
In 2025, the Federal cultural investment was $1.23 per person.
Arkansas Congressional Districts
In 2025, the three agencies (NEA, NEH and IMLS) awarded grants in 100% of the US Congressional Districts (4 of 4) in Arkansas.
If you would like a detailed list of grants by district, please email keren@usregionalarts.org.
18 grants from NEA totaling $1,393,758
7 grants from NEH totaling $541,517
4 grants from IMLS totaling $2,060,590
Geographic Reach
24 grants to 3 metropolitan areas
4 grants to 3 micropolitan areas
1 grant to 1 rural area
Population Insights
Total state population – 1,987,864
In 2023, the Federal cultural investment was $2.01 per person.
Nebraska Congressional Districts
In 2023-2024, the three agencies (NEA, NEH and IMLS) awarded grants in 100% of the US Congressional Districts (3 of 3 districts) in Nebraska.
If you would like a detailed list of grants awarded by district, please email keren@usregionalarts.org.
17 grants from NEA totaling $1,389,900
6 grants from NEH totaling $941,571
6 grants from IMLS totaling $2,051,652
Geographic Reach
22 grants to 3 metropolitan areas
2 grants to 2 micropolitan areas
5 grants to 3 rural areas
Population Insights
Total state population – 2,005,465
In 2024, the Federal cultural investment was $2.19 per person.
Nebraska Congressional Districts
In 2023-2024, the three agencies (NEA, NEH and IMLS) awarded grants in 100% of the US Congressional Districts (3 of 3 districts) in Nebraska.
If you would like a detailed list of grants awarded by district, please email keren@usregionalarts.org.
10 grants from NEA totaling $1,410,838
12 grants from NEH totaling $24,300
7 grants from IMLS totaling $3,692,232
Geographic Reach
24 grants to 2 metropolitan areas
1 grant to 1 micropolitan area
4 grants to 3 rural areas
Population Insights
Total state population – 2,018,006
In 2025, the Federal cultural investment was $2.54 per person.
Nebraska Congressional Districts
In 2025, the three agencies (NEA, NEH and IMLS) awarded grants in 100% of the US Congressional Districts (3 of 3) in Nebraska.
If you would like a detailed list of grants by district, please email keren@usregionalarts.org.
15 grants from NEA totaling $1,293,663
4 grants from NEH totaling $357,356
3 grants from IMLS totaling $149,659
Geographic Reach
19 grants to 6 metropolitan areas
1 grant to 1 micropolitan area
2 grants to 1 rural area
Population Insights
Total state population – 2,951,500
In 2023, the Federal cultural investment was $0.61 per person.
Kansas Congressional Districts
In 2023-2024, the three agencies (NEA, NEH and IMLS) awarded grants in 100% of the US Congressional Districts (4 of 4 districts) in Kansas.
If you would like a detailed list of grants awarded by district, please email keren@usregionalarts.org.
12 grants from NEA totaling $1,174,096
5 grants from NEH totaling $494,732
2 grants from IMLS totaling $2,119,780
Geographic Reach
17 grants to 6 metropolitan areas
2 grants to 2 rural areas
Population Insights
Total state population – 2,970,606
In 2024, the Federal cultural investment was $1.28 per person.
Kansas Congressional Districts
In 2023-2024, the three agencies (NEA, NEH and IMLS) awarded grants in 100% of the US Congressional Districts (4 of 4 districts) in Kansas.
If you would like a detailed list of grants awarded by district, please email keren@usregionalarts.org.
3 grants from NEA totaling $1,006,083
7 grants from NEH totaling $14,175
2 grants from IMLS totaling $2,117,788
Geographic Reach
11 grants to 6 metropolitan areas
1 grant to 1 rural area
Population Insights
Total state population – 2,977,220
In 2025, the Federal cultural investment was $1.05 per person.
Kansas Congressional Districts
In 2025, the three agencies (NEA, NEH and IMLS) awarded grants in 100% of the US Congressional Districts (4 of 4) in Kansas.
If you would like a detailed list of grants by district, please email keren@usregionalarts.org.
43 grants from NEA totaling $3,612,526
10 grants from NEH totaling $1,047,113
8 grants from IMLS totaling $5,108,472
Geographic Reach
59 grants to 7 metropolitan areas
1 grant to 1 micropolitan area
1 grant to 1 rural area
Population Insights
Total state population – 6,208,038
In 2023, the Federal cultural investment was $1.57 per person.
Missouri Congressional Districts
In 2023-2024, the three agencies (NEA, NEH and IMLS) awarded grants in 100% of the US Congressional Districts (8 of 8 districts) in Missouri.
If you would like a detailed list of grants awarded by district, please email keren@usregionalarts.org.
37 grants from NEA totaling $3,669,545
4 grants from NEH totaling $664,782
9 grants from IMLS totaling $4,942,609
Geographic Reach
47 grants to 6 metropolitan areas
2 grants to 2 micropolitan areas
1 grant to 1 rural area
Population Insights
Total state population – 6,245,466
In 2024, the Federal cultural investment was $1.49 per person.
Missouri Congressional DistrictsIn 2023-2024, the three agencies (NEA, NEH and IMLS) awarded grants in 100% of the US Congressional Districts (8 of 8 districts) in Missouri.
If you would like a detailed list of grants awarded by district, please email keren@usregionalarts.org.
21 grants from NEA totaling $3,321,167
9 grants from NEH totaling $18,225
7 grants from IMLS totaling $4,429,792
Geographic Reach
36 grants to 7 metropolitan areas
1 grant to 1 rural area
Population Insights
Total state population – 6,270,541
In 2025, the Federal cultural investment was $1.24 per person.
Missouri Congressional Districts
In 2025, the three agencies (NEA, NEH and IMLS) awarded grants in 63% of the US Congressional Districts (5 of 8) in Missouri.
If you would like a detailed list of grants by district, please email keren@usregionalarts.org.

419 grants from NEA totaling $21,187,146
154 grants from NEH totaling $18,334,504
98 grants from IMLS totaling $34,570,195
Geographic Reach
594 grants to 123 metropolitan areas
46 grants to 30 micropolitan areas
33 grants to 23 rural areas
Population insights
Total region population – 58,038,999
In 2023, the average Federal cultural investment was $1.48 per person in the Midwestern region.
Arts Midwest’s Congressional Districts
In 2023, the three cultural agencies awarded grants in 96% of the US Congressional Districts (73 of 76 districts) in the Midwestern region.
359 grants from NEA totaling $21,553,883
122 grants from NEH totaling $14,858,755
95 grants from IMLS totaling $45,802,969
Geographic Reach
506 grants to 108 metropolitan areas
59 grants to 33 micropolitan areas
18 grants to 12 rural areas
Population insights
Total region population – 58,375,047
In 2024, the average Federal cultural investment was $1.76 per person in the Midwestern region.
Arts Midwest’s Congressional Districts
In 2024, the three cultural agencies awarded grants in 88% of the US Congressional Districts (67 of 76 districts) in the Midwestern region.
178 grants from NEA totaling $17,162,530
244 grants from NEH totaling $32,631,975
66 grants from IMLS totaling $39,731,332
Geographic Reach
400 grants to 86 metropolitan areas
45 grants to 28 micropolitan areas
43 grants to 30 rural areas
Population Insights
Total Midwest region population – 55,258,512
In 2025, the Federal cultural investment was $1.62 per person.
Arts Midwest’s Congressional Districts
In 2025, the three agencies (NEA, NEH and IMLS) awarded grants in 92% of the US Congressional Districts (70 of 76) in the Midwest Region.
If you would like a detailed list of grants by region, please email keren@usregionalarts.org.
7 grants from NEA totaling $1,210,580
3 grants from NEH totaling $96,169
6 grants from IMLS totaling $1,720,612
Geographic Reach
4 grants to 2 metropolitan areas
6 grants to 1 micropolitan area
6 grants to 4 rural areas
Population Insights
Total state population – 918,305
In 2023, the Federal cultural investment was $3.30 per person.
South Dakota Congressional Districts
In 2023-2024, the three agencies (NEA, NEH and IMLS) awarded grants in 100% of the US Congressional Districts (1 of 1 districts) in South Dakota.
If you would like a detailed list of grants awarded by district, please email keren@usregionalarts.org.
8 grants from NEA totaling $1,215,400
3 grants from NEH totaling $216,000
2 grants from IMLS totaling $1,356,956
Geographic Reach
4 grants to 2 metropolitan areas
7 grants to 2 micropolitan areas
2 grants to 2 rural areas
Population Insights
Total state population – 924,669
In 2024, the Federal cultural investment was $3.02 per person.
South Dakota Congressional Districts
In 2023-2024, the three agencies (NEA, NEH and IMLS) awarded grants in 100% of the US Congressional Districts (1 of 1 districts) in South Dakota.
If you would like a detailed list of grants awarded by district, please email keren@usregionalarts.org.
6 grants from NEA totaling $1,292,438
6 grants from NEH totaling $287,758
5 grants from IMLS totaling $1,473,336
Geographic Reach
5 grants to 2 metropolitan areas
7 grants to 3 micropolitan areas
5 grants to 5 rural areas
Population Insights
Total state population – 935,094
In 2025, the Federal cultural investment was $3.27 per person.
South Dakota Congressional Districts
In 2025, the three agencies (NEA, NEH and IMLS) awarded grants in 100% of the US Congressional Districts (1 of 1) in South Dakota.
If you would like a detailed list of grants by district, please email keren@usregionalarts.org.
12 grants from NEA totaling $1,077,093
4 grants from NEH totaling $624,619
5 grants from IMLS totaling $991,340
Geographic Reach
17 grants to 8 metropolitan areas
1 grant to 1 micropolitan area
3 grants to 2 rural areas
Population Insights
Total state population – 3,218,414
In 2023, the Federal cultural investment was $0.84 per person.
Iowa Congressional Districts
In 2023-2024, the three agencies (NEA, NEH, and IMLS) awarded grants in 100% of the US Congressional Districts (4 of 4 districts) in Iowa.
If you would like a detailed list of grants by district, please email keren@usregionalarts.org.
13 grants from NEA totaling $1,215,000
6 grants from NEH totaling $1,860,053
3 grants from IMLS totaling $2,481,368
Geographic Reach
22 grants to 7 metropolitan areas
Population Insights
Total state population – 3,241,488
In 2024, the Federal cultural investment was $1.71 per person.
Iowa Congressional Districts
In 2023-2024, the three agencies (NEA, NEH and IMLS) awarded grants in 100% of the US Congressional Districts (4 of 4 districts) in Iowa.
If you would like a detailed list of grants by district, please email keren@usregionalarts.org.
7 grants from NEA totaling $1,062,363
8 grants from NEH totaling $2,335,466
2 grants from IMLS totaling $2,475,644
Geographic Reach
15 grants to 3 metropolitan areas
2 grants to 2 micropolitan areas
Population Insights
Total state population – 3,238,387
In 2025, the Federal cultural investment was $1.81 per person.
Iowa Congressional Districts
In 2025, the three agencies (NEA, NEH and IMLS) awarded grants in 75% of the US Congressional Districts (3 of 4) in Iowa.
If you would like a detailed list of grants by district, please email keren@usregionalarts.org.
89 grants from NEA totaling $5,277,626
16 grants from NEH totaling $1,452,283
7 grants from IMLS totaling $4,228,149
Geographic Reach
101 grants to 11 metropolitan areas
8 grants to 5 micropolitan areas
3 grants to 3 rural areas
Population Insights
Total state population – 5,753,048
In 2023, the Federal cultural investment was $1.90 per person.
Minnesota Congressional Districts
In 2023-2024, the three agencies (NEA, NEH and IMLS) awarded grants in 100% of the US Congressional Districts (8 of 8 districts) in Minnesota.
If you would like a detailed list of grants awarded by district, please email keren@usregionalarts.org.
83 grants from NEA totaling $5,197,512
17 grants from NEH totaling $2,500,859
10 grants from IMLS totaling $4,729,843
Geographic Reach
96 grants to 14 metropolitan areas
12 grants to 6 micropolitan areas
6 grants to 2 rural areas
Population Insights
Total state population – 5,793,151
In 2024, the Federal cultural investment was $2.15 per person.
Minnesota Congressional Districts
In 2023-2024, the three agencies (NEA, NEH and IMLS) awarded grants in 100% of the US Congressional Districts (8 of 8 districts) in Minnesota.
If you would like a detailed list of grants awarded by district, please email keren@usregionalarts.org.
34 grants from NEA totaling $4,132,850
24 grants from NEH totaling $3,330,996
4 grants from IMLS totaling $3,204,553
Geographic Reach
52 grants to 6 metropolitan areas
8 grants to 4 micropolitan areas
2 grants to 2 rural areas
Population Insights
Total state population – 5,830,405
In 2025, the Federal cultural investment was $1.83 per person.
Minnesota Congressional Districts
In 2025, the three agencies (NEA, NEH and IMLS) awarded grants in 100% of the US Congressional Districts (8 of 8) in Minnesota.
If you would like a detailed list of grants by district, please email keren@usregionalarts.org.
48 grants from NEA totaling $2,051,925
29 grants from NEH totaling $3,381,734
21 grants from IMLS totaling $7,447,783
Geographic Reach
79 grants to 25 metropolitan areas
18 grants to 11 micropolitan areas
3 grants to 3 rural areas
Population Insights
Total state population – 10,083,356
In 2023, the Federal cultural investment was $1.28 per person.
Michigan Congressional Districts
In 2023-2024, the three agencies (NEA, NEH, and IMLS) awarded grants in 100% of the US Congressional Districts (13 of 13 districts) in Michigan.
If you would like a detailed list of grants awarded by district, please email keren@usregionalarts.org.
46 grants from NEA totaling $2,289,125
18 grants from NEH totaling $1,851,985
23 grants from IMLS totaling $8,177,179
Geographic Reach
65 grants to 24 metropolitan areas
21 grants to 10 micropolitan areas
1 grant to 1 rural area
Population Insights
Total state population – 10,140,459
In 2024, the Federal cultural investment was $1.21 per person.
Michigan Congressional Districts
In 2023-2024, the three agencies (NEA, NEH and IMLS) awarded grants in 100% of the US Congressional Districts (13 of 13 districts) in Michigan.
If you would like a detailed list of grants awarded by district, please email keren@usregionalarts.org.
21 grants from NEA totaling $1,627,484
46 grants from NEH totaling $4,643,948
15 grants from IMLS totaling $7,325,557
Geographic Reach
60 grants to 14 metropolitan areas
9 grants to 6 micropolitan areas
13 grants to 8 rural areas
Population Insights
Total state population – 10,127,884
In 2025, the Federal cultural investment was $1.34 per person.
Michigan Congressional Districts
In 2025, the three agencies (NEA, NEH and IMLS) awarded grants in 85% of the US Congressional Districts (11 of 13) in Michigan.
If you would like a detailed list of grants by district, please email keren@usregionalarts.org.
5 grants from NEA totaling $1,034,728
1 grant from NEH totaling $52,648
2 grants from IMLS totaling $20,000
Geographic Reach
6 grants to 3 metropolitan areas
2 grants to 2 rural areas
Population Insights
Total state population – 789,047
In 2023, the Federal cultural investment was $1.40 per person.
North Dakota Congressional Districts
In 2023-2024, the three agencies (NEA, NEH, and IMLS) awarded grants in 100% of the US Congressional Districts (1 of 1 districts) in North Dakota.
If you would like a detailed list of grants awarded by district, please email keren@usregionalarts.org.
1 grant from NEA totaling $933,513
2 grants from IMLS totaling $1,305,858
Geographic Reach
2 grants to 1 metropolitan area
1 grant to 1 rural area
Population Insights
Total state population – 796,568
In 2024, the Federal cultural investment was $2.81 per person.
North Dakota Congressional Districts
In 2023-2024, the three agencies (NEA, NEH and IMLS) awarded grants in 100% of the US Congressional Districts (1 of 1 districts) in North Dakota.
If you would like a detailed list of grants awarded by district, please email keren@usregionalarts.org.
1 grant from NEA totaling $1,033,171
1 grant from NEH totaling $49,920
3 grants from IMLS totaling $1,332,053
Geographic Reach
3 grants to 2 metropolitan areas
2 grants to 1 rural area
Population Insights
Total state population – 799,358
In 2025, the Federal cultural investment was $3.02 per person.
North Dakota Congressional Districts
In 2025, the three agencies (NEA, NEH and IMLS) awarded grants in 100% of the US Congressional Districts (1 of 1) in North Dakota.
If you would like a detailed list of grants by district, please email keren@usregionalarts.org.
31 grants from NEA totaling $1,733,000
12 grants from NEH totaling $1,007,196
19 grants from IMLS totaling $2,551,398
Geographic Reach
48 grants to 10 metropolitan areas
1 grant to 2 micropolitan areas
13 grants to 7 rural areas
Population Insights
Total state population – 5,930,405
In 2023, the Federal cultural investment was $0.89 per person.
Wisconsin Congressional Districts
In 2023-2024, the three agencies (NEA, NEH, and IMLS) awarded grants in 100% of the US Congressional Districts (8 of 8 districts) in Wisconsin.
If you would like a detailed list of grants awarded by district, please email keren@usregionalarts.org.
21 grants from NEA totaling $1,693,600
20 grants from NEH totaling $1,525,558
17 grants from IMLS totaling $4,624,381
Geographic Reach
44 grants to 11 metropolitan areas
7 grants to 6 micropolitan areas
7 grants to 5 rural areas
Population Insights
Total state population – 5,960,975
In 2024, the Federal cultural investment was $1.32 per person.
Wisconsin Congressional Districts
In 2023-2024, the three agencies (NEA, NEH and IMLS) awarded grants in 100% of the US Congressional Districts (8 of 8 districts) in Wisconsin.
If you would like a detailed list of grants awarded by district, please email keren@usregionalarts.org.
16 grants from NEA totaling $1,669,226
29 grants from NEH totaling $3,181,050
14 grants from IMLS totaling $4,266,067
Geographic Reach
45 grants to 12 metropolitan areas
2 grants to 2 micropolitan areas
12 grants to 8 rural areas
Population Insights
Total state population – 5,972,787
In 2025, the Federal cultural investment was $1.53 per person.
Wisconsin Congressional Districts
In 2025, the three agencies (NEA, NEH and IMLS) awarded grants in 88% of the US Congressional Districts (7 of 8) in Wisconsin.
If you would like a detailed list of grants by district, please email keren@usregionalarts.org.
134 grants from NEA totaling $4,314,483
40 grants from NEH totaling $4,728,224
20 grants from IMLS totaling $10,637,384
Geographic Reach
189 grants to 30 metropolitan areas
3 grants to 3 micropolitan areas
2 grants to 1 rural area
Population Insights
Total state population – 12,642,259
In 2023, the Federal cultural investment was $1.56 per person.
Illinois Congressional Districts
In 2023-2024, the three agencies (NEA, NEH and IMLS) awarded grants in 94% of the US Congressional Districts (16 of 17 districts) in Illinois.
If you would like a detailed list of grants awarded by district, please email keren@usregionalarts.org.
109 grants from NEA totaling $4,375,200
24 grants from NEH totaling $2,865,615
25 grants from IMLS totaling $11,347,695
Geographic Reach
156 grants to 24 metropolitan areas
1 grant to 1 micropolitan area
1 grant to 1 rural area
Population Insights
Total state population – 12,710,158
In 2024, the Federal cultural investment was $1.46 per person.
Illinois Congressional Districts
In 2023-2024, the three agencies (NEA, NEH and IMLS) awarded grants in 94% of the US Congressional Districts (16 of 17 districts) in Illinois.
If you would like a detailed list of grants awarded by district, please email keren@usregionalarts.org.
54 grants from NEA totaling $2,668,457
58 grants from NEH totaling $6,949,506
4 grants from IMLS totaling $6,667,801
Geographic Reach
107 grants to 20 metropolitan areas
3 grants to 3 micropolitan areas
6 grants to 3 rural areas
Population Insights
Total state population – 12,719,141
In 2025, the Federal cultural investment was $1.28 per person.
Illinois Congressional Districts
In 2025, the three agencies (NEA, NEH and IMLS) awarded grants in 94% of the US Congressional Districts (16 of 17) in Illinois.
If you would like a detailed list of grants by district, please email keren@usregionalarts.org.
68 grants from NEA totaling $2,857,011
25 grants from NEH totaling $4,202,208
11 grants from IMLS totaling $2,201,006
Geographic Reach
97 grants to 23 metropolitan areas
7 grants to 5 micropolitan areas
Population Insights
Total state population – 11,824,034
In 2023, the Federal cultural investment was $0.78 per person.
Ohio Congressional Districts
In 2023-2024, the three agencies (NEA, NEH, and IMLS) awarded grants in 100% of the US Congressional Districts (15 of 15 districts) in Ohio.
If you would like a detailed list of grants awarded by district, please email keren@usregionalarts.org.
61 grants from NEA totaling $3,178,300
16 grants from NEH totaling $2,072,521
8 grants from IMLS totaling $7,639,678
Geographic Reach
80 grants to 16 metropolitan areas
8 grants to 5 micropolitan areas
Population Insights
Total state population – 11,883,304
In 2024, the Federal cultural investment was $1.08 per person.
Ohio Congressional Districts
In 2023-2024, the three agencies (NEA, NEH and IMLS) awarded grants in 100% of the US Congressional Districts (15 of 15 districts) in Ohio.
If you would like a detailed list of grants awarded by district, please email keren@usregionalarts.org.
30 grants from NEA totaling $2,225,403
36 grants from NEH totaling $7,666,394
14 grants from IMLS totaling $9,060,017
Geographic Reach
66 grants to 19 metropolitan areas
12 grants to 6 micropolitan areas
2 grants to 2 rural areas
Population Insights
Total state population – 11,900,510
In 2025, the Federal cultural investment was $1.59 per person.
Ohio Congressional Districts
In 2025, the three agencies (NEA, NEH and IMLS) awarded grants in 100% of the US Congressional Districts (15 of 15) in Ohio.
If you would like a detailed list of grants by district, please email keren@usregionalarts.org.
25 grants from NEA totaling $1,630,700
24 grants from NEH totaling $2,789,423
7 grants from IMLS totaling $4,772,523
Geographic Reach
53 grants to 11 metropolitan areas
2 grants to 2 micropolitan areas
1 grant to 1 rural area
Population Insights
Total state population – 6,880,131
In 2023, the Federal cultural investment was $1.34 per person.
Indiana Congressional Districts
In 2023-2024, the three agencies (NEA, NEH, and IMLS) awarded grants in 89% of the US Congressional Districts (8 of 9 districts) in Indiana.
If you would like a detailed list of grants awarded by district, please email keren@usregionalarts.org.
17 grants from NEA totaling $1,456,183
18 grants from NEH totaling $1,966,164
5 grants from IMLS totaling $4,140,011
Geographic Reach
37 grants to 9 metropolitan areas
3 grants to 3 micropolitan areas
Population Insights
Total state population – 6,924,275
In 2024, the Federal cultural investment was $1.09 per person.
Indiana Congressional Districts
In 2023-2024, the three agencies (NEA, NEH and IMLS) awarded grants in 89% of the US Congressional Districts (8 of 9 districts) in Indiana.
If you would like a detailed list of grants awarded by district, please email keren@usregionalarts.org.
9 grants from NEA totaling $1,451,138
36 grants from NEH totaling $4,186,937
5 grants from IMLS totaling $3,926,304
Geographic Reach
47 grants to 8 metropolitan areas
2 grants to 2 micropolitan areas
1 grant to 1 rural area
Population Insights
Total state population – 6,973,333
In 2025, the Federal cultural investment was $1.37 per person.
Indiana Congressional Districts
In 2025, the three agencies (NEA, NEH and IMLS) awarded grants in 88% of the US Congressional Districts (8 of 9) in Indiana.
If you would like a detailed list of grants by district, please email keren@usregionalarts.org.

179 grants from NEA totaling $11,985,240
108 grants from NEH totaling $14,189,775
31 grants from IMLS totaling $9,686,911
Geographic Reach
266 grants to 86 metropolitan areas
37 grants to 24 micropolitan areas
16 grants to 14 rural areas
Population insights
Total region population – 15,263,573
In 2023, the average Federal cultural investment was $2.74 per person in the New England region.
NEFA’s Congressional Districts
In 2023, the three cultural agencies awarded grants in 100% of the US Congressional Districts (21 of 21 districts) in the New England region.
183 grants from NEA totaling $12,736,785
83 grants from NEH totaling $13,168,913
48 grants from IMLS totaling $18,383,717
Geographic Reach
268 grants to 89 metropolitan areas
31 grants to 21 micropolitan areas
15 grants to 10 rural areas
Population insights
Total region population – 15,386,085
In 2024, the average Federal cultural investment was $3.19 per person in the New England region.
NEFA’s Congressional Districts
In 2024, the three cultural agencies awarded grants in 95% of the US Congressional Districts (20 of 21 districts) in the New England region.
84 grants from NEA totaling $9,823,041
152 grants from NEH totaling $26,452,335
16 grants from IMLS totaling $14,522,759
Geographic Reach
189 grants to 54 metropolitan areas
29 grants to 15 micropolitan areas
34 grants to 25 rural areas
Population Insights
Total region population – 15,431,980
In 2025, the Federal cultural investment was $3.29 per person.
NEFA’s Congressional Districts
In 2025, the three agencies (NEA, NEH and IMLS) awarded grants in 100% of the US Congressional Districts (21 of 21) in the New England region.
If you would like a detailed list of grants by district, please email keren@usregionalarts.org.
89 grants from NEA totaling $5,166,674
57 grants from NEH totaling $10,012,224
14 grants from IMLS totaling $2,578,716
Geographic Reach
155 grants to 47 metropolitan areas
4 grants to 3 micropolitan areas
1 grant to 1 rural area
Population Insights
Total state population – 7,066,568
In 2023, the Federal cultural investment was $2.51 per person.
Massachusetts Congressional Districts
In 2023-2024, the three agencies (NEA, NEH and IMLS) awarded grants in 100% of the US Congressional Districts (9 of 9 districts) in Massachusetts.
If you would like a detailed list of grants awarded by district, please email keren@usregionalarts.org.
97 grants from NEA totaling $5,626,400
43 grants from NEH totaling $8,177,806
27 grants from IMLS totaling $8,457,163
Geographic Reach
162 grants to 49 metropolitan areas
5 grants to 5 micropolitan areas
Population Insights
Total state population – 7,136,171
In 2024, the Federal cultural investment was $3.12 per person.
Massachusetts Congressional Districts
In 2023-2024, the three agencies (NEA, NEH and IMLS) awarded grants in 100% of the US Congressional Districts (9 of 9 districts) in Massachusetts.
If you would like a detailed list of grants awarded by district, please email keren@usregionalarts.org.
38 grants from NEA totaling $3,810,369
75 grants from NEH totaling $15,324,087
4 grants from IMLS totaling $5,424,563
Geographic Reach
110 grants to 28 metropolitan areas
4 grants to 3 micropolitan areas
3 grants to 2 rural areas
Population Insights
Total state population – 7,154,084
In 2025, the Federal cultural investment was $3.43 per person.
Massachusetts Congressional Districts
In 2025, the three agencies (NEA, NEH and IMLS) awarded grants in 100% of the US Congressional Districts (9 of 9) in Massachusetts.
If you would like a detailed list of grants by district, please email keren@usregionalarts.org.
14 grants from NEA totaling $1,294,100
9 grants from NEH totaling $728,906
2 grants from IMLS totaling $452,409
Geographic Reach
25 grants to 3 metropolitan areas
Population Insights
Total state population – 1,103,429
In 2023, the Federal cultural investment was $2.24 per person.
Rhode Island Congressional Districts
In 2023-2024, the three agencies (NEA, NEH and IMLS) awarded grants in 100% of the US Congressional Districts (2 of 2 districts) in Rhode Island.
If you would like a detailed list of grants awarded by district, please email keren@usregionalarts.org.
15 grants from NEA totaling $1,363,825
8 grants from NEH totaling $551,432
5 grants from IMLS totaling $2,197,643
Geographic Reach
28 grants to 3 metropolitan areas
Population Insights
Total state population – 1,112,308
In 2024, the Federal cultural investment was $3.70 per person.
Rhode Island Congressional Districts
In 2023-2024, the three agencies (NEA, NEH and IMLS) awarded grants in 100% of the US Congressional Districts (2 of 2 districts) in Rhode Island.
If you would like a detailed list of grants awarded by district, please email keren@usregionalarts.org.
9 grants from NEA totaling $1,334,383
18 grants from NEH totaling $2,730,440
1 grant from IMLS totaling $1,414,798
Geographic Reach
28 grants to 3 metropolitan areas
Population Insights
Total state population – 1,114,521
In 2025, the Federal cultural investment was $4.92 per person.
Rhode Island Congressional Districts
In 2025, the three agencies (NEA, NEH and IMLS) awarded grants in 100% of the US Congressional Districts (2 of 2) in Rhode Island.
If you would like a detailed list of grants by district, please email keren@usregionalarts.org.
18 grants from NEA totaling $1,277,366
6 grants from NEH totaling $1,088,486
3 grants from IMLS totaling $1,394,202
Geographic Reach
10 grants to 6 metropolitan areas
13 grants to 8 micropolitan areas
4 grants to 3 rural areas
Population Insights
Total state population – 648,708
In 2023, the Federal cultural investment was $5.80 per person.
Vermont Congressional Districts
In 2023-2024, the three agencies (NEA, NEH and IMLS) awarded grants in 100% of the US Congressional Districts (1 of 1 districts) in Vermont.
If you would like a detailed list of grants awarded by district, please email keren@usregionalarts.org.
19 grants from NEA totaling $1,330,735
6 grants from NEH totaling $282,580
2 grants from IMLS totaling $1,419,386
Geographic Reach
7 grants to 4 metropolitan areas
14 grants to 10 micropolitan areas
6 grants to 2 rural areas
Population Insights
Total state population – 648,493
In 2024, the Federal cultural investment was $4.68 per person.
Vermont Congressional Districts
In 2023-2024, the three agencies (NEA, NEH and IMLS) awarded grants in 100% of the US Congressional Districts (1 of 1 districts) in Vermont.
If you would like a detailed list of grants awarded by district, please email keren@usregionalarts.org.
7 grants from NEA totaling $1,199,138
10 grants from NEH totaling $1,021,266
1 grant from IMLS totaling $1,241,835
Geographic Reach
2 grants to 2 metropolitan areas
1 grant to 1 micropolitan area
15 grants to 7 rural areas
Population Insights
Total state population – 644,663
In 2025, the Federal cultural investment was $5.37 per person.
Vermont Congressional Districts
In 2025, the three agencies (NEA, NEH and IMLS) awarded grants in 100% of the US Congressional Districts (1 of 1) in Vermont.
If you would like a detailed list of grants by district, please email keren@usregionalarts.org.
30 grants from NEA totaling $1,825,100
15 grants from NEH totaling $783,676
6 grants from IMLS totaling $3,194,863
Geographic Reach
47 grants to 17 metropolitan areas
4 grants to 4 micropolitan areas
Population Insights
Total state population – 3,643,023
In 2023, the Federal cultural investment was $1.59 per person.
Connecticut Congressional Districts
In 2023-2024, the three agencies (NEA, NEH and IMLS) awarded grants in 100% of the US Congressional Districts (5 of 5 districts) in Connecticut.
If you would like a detailed list of grants awarded by district, please email keren@usregionalarts.org.
28 grants from NEA totaling $1,920,100
13 grants from NEH totaling $1,849,925
7 grants from IMLS totaling $2,927,557
Geographic Reach
48 grants to 22 metropolitan areas
Population Insights
Total state population – 3,675,069
In 2024, the Federal cultural investment was $1.82 per person.
Connecticut Congressional Districts
In 2023-2024, the three agencies (NEA, NEH and IMLS) awarded grants in 100% of the US Congressional Districts (5 of 5 districts) in Connecticut.
If you would like a detailed list of grants awarded by district, please email keren@usregionalarts.org.
14 grants from NEA totaling $1,555,568
25 grants from NEH totaling $2,602,671
3 grants from IMLS totaling $2,420,494
Geographic Reach
36 grants to 15 metropolitan areas
6 grants to 4 micropolitan areas
Population Insights
Total state population – 3,688,496
In 2025, the Federal cultural investment was $1.78 per person.
Connecticut Congressional Districts
In 2025, the three agencies (NEA, NEH and IMLS) awarded grants in 100% of the US Congressional Districts (5 of 5) in Connecticut.
If you would like a detailed list of grants by district, please email keren@usregionalarts.org.
3 grants from NEA totaling $959,200
9 grants from NEH totaling $319,249
4 grants from IMLS totaling $1,664,303
Geographic Reach
3 grants to 3 metropolitan areas
12 grants to 5 micropolitan areas
1 grant to 1 rural area
Population Insights
Total state population – 1,402,199
In 2023, the Federal cultural investment was $2.10 per person.
New Hampshire Congressional Districts
In 2023-2024, the three agencies (NEA, NEH and IMLS) awarded grants in 100% of the US Congressional Districts (2 of 2 districts) in New Hampshire.
If you would like a detailed list of grants awarded by district, please email keren@usregionalarts.org.
4 grants from NEA totaling $981,200
8 grants from NEH totaling $1,428,766
2 grants from IMLS totaling $1,553,464
Geographic Reach
6 grants to 4 metropolitan areas
8 grants to 4 micropolitan areas
Population Insights
Total state population – 1,409,032
In 2024, the Federal cultural investment was $2.81 per person.
New Hampshire Congressional Districts
In 2023-2024, the three agencies (NEA, NEH and IMLS) awarded grants in 100% of the US Congressional Districts (2 of 2 districts) in New Hampshire.
If you would like a detailed list of grants awarded by district, please email keren@usregionalarts.org.
4 grants from NEA totaling $561,000
13 grants from NEH totaling $2,550,498
1 grant from IMLS totaling $1,525,451
Geographic Reach
2 grants to 1 metropolitan area
13 grants to 4 micropolitan areas
3 grants to 3 rural areas
Population Insights
Total state population – 1,415,342
In 2025, the Federal cultural investment was $3.28 per person.
New Hampshire Congressional Districts
In 2025, the three agencies (NEA, NEH and IMLS) awarded grants in 100% of the US Congressional Districts (2 of 2) in New Hampshire.
If you would like a detailed list of grants by district, please email keren@usregionalarts.org.
25 grants from NEA totaling $1,462,800
12 grants from NEH totaling $1,248,234
3 grants from IMLS totaling $402,418
Geographic Reach
26 grants to 10 metropolitan areas
4 grants to 3 micropolitan areas
10 grants to 9 rural areas
Population Insights
Total state population – 1,399,646
In 2023, the Federal cultural investment was $2.22 per person.
Maine Congressional Districts
In 2023-2024, the three agencies (NEA, NEH and IMLS) awarded grants in 100% of the US Congressional Districts (2 of 2 districts) in Maine.
If you would like a detailed list of grants awarded by district, please email keren@usregionalarts.org.
20 grants from NEA totaling $1,514,525
5 grants from NEH totaling $878,404
5 grants from IMLS totaling $1,828,504
Geographic Reach
17 grants to 7 metropolitan areas
4 grants to 2 micropolitan areas
9 grants to 8 rural areas
Population Insights
Total state population – 1,405,012
In 2024, the Federal cultural investment was $3.00 per person.
Maine Congressional Districts
In 2023-2024, the three agencies (NEA, NEH and IMLS) awarded grants in 100% of the US Congressional Districts (2 of 2 districts) in Maine.
If you would like a detailed list of grants awarded by district, please email keren@usregionalarts.org.
12 grants from NEA totaling $1,362,583
11 grants from NEH totaling $2,223,373
6 grants from IMLS totaling $2,495,618
Geographic Reach
11 grants to 5 metropolitan areas
5 grants to 3 micropolitan areas
13 grants to 13 rural areas
Population Insights
Total state population – 1,414,874
In 2025, the Federal cultural investment was $4.30 per person.
Maine Congressional Districts
In 2025, the three agencies (NEA, NEH and IMLS) awarded grants in 100% of the US Congressional Districts (2 of 2) in Maine.
If you would like a detailed list of grants by district, please email keren@usregionalarts.org.

977 grants from NEA totaling $37,363,062
268 grants from NEH totaling $32,154,691
109 grants from IMLS totaling $35,826,814
Geographic Reach
1300 grants to 215 metropolitan areas
26 grants to 19 micropolitan areas
28 grants to 22 rural areas
Population insights
Total region population – 63,889,428
In 2023, the average Federal cultural investment was $1.51 per person in the Mid-Atlantic region.
Mid Atlantic Arts’ Congressional Districts
In 2023, the three cultural agencies awarded grants in 95% of the US Congressional Districts (75 of 79 districts), in 100% of the US Territories (2 of 2 territories) and the District of Columbia in the mid-Atlantic region.
877 grants from NEA totaling $40,000,025
230 grants from NEH totaling $31,628,510
142 grants from IMLS totaling $60,874,745
Geographic Reach
1204 grants to 201 metropolitan areas
24 grants to 15 micropolitan areas
21 grants to 16 rural areas
Population insights
Total region population – 64,353,083
In 2024, the average Federal cultural investment was $3.89 per person in the Mid-Atlantic region.
Mid-Atlantic Arts’ Congressional Districts
In 2024, the three cultural agencies awarded grants in 99% of the US Congressional Districts (78 of 79 districts), in 100% of the US Territories (2 of 2 territories) and the District of Columbia in the mid-Atlantic region.
387 grants from NEA totaling $24,642,246
470 grants from NEH totaling $82,855,665
46 grants from IMLS totaling $53,865,464
Geographic Reach
824 grants to 155 metropolitan areas
44 grants to 30 micropolitan areas
35 grants to 27 rural areas
Population Insights
Total region population – 64,544,245
In 2025, the Federal cultural investment was $2.50 per person.
Mid-Atlantic Arts’ Congressional Districts
In 2025, the three agencies (NEA, NEH and IMLS) awarded grants in 96% of the US Congressional Districts (74 of 77) in the mid-Atlantic region.
If you would like a detailed list of grants by district, please email keren@usregionalarts.org.
10 grants from NEA totaling $1,157,915
8 grants from NEH totaling $952,428
3 grants from IMLS totaling $577,501
Geographic Reach
21 grants to 7 metropolitan areas
Population Insights
Total population – 3,203,792
In 2023, the Federal cultural investment was $0.84 per person.
Puerto Rico Representation
In 2023-2024, the three agencies (NEA, NEH and IMLS) awarded grants in the US territory in Puerto Rico, represented by a non-voting delegate.
If you would like a detailed list of grants for this territory, please email keren@usregionalarts.org.
14 grants from NEA totaling $1,356,550
3 grants from NEH totaling $101,593
4 grants from IMLS totaling $2,751,354
Geographic Reach
21 grants to 6 metropolitan areas
Population Insights
Total population – 3,203,295
In 2024, the Federal cultural investment was $1.31 per person.
Puerto Rico Representation
In 2023-2024, the three agencies (NEA, NEH and IMLS) awarded grants in the US territory in Puerto Rico, represented by a non-voting delegate.
If you would like a detailed list of grants for this territory, please email keren@usregionalarts.org.
7 grants from NEA totaling $1,175,423
7 grants from NEH totaling $469,164
3 grants from IMLS totaling $2,135,587
Geographic Reach
15 grants to 4 metropolitan areas
2 grants to 1 micropolitan area
Population Insights
Total state population – 3,184,835
In 2025, the Federal cultural investment was $1.17 per person.
Puerto Rico Representation
In 2025, the three agencies (NEA, NEH and IMLS) awarded grants in the US territory in Puerto Rico, represented by a non-voting delegate.
If you would like a detailed list of grants for this territory, please email keren@usregionalarts.org.
In 2023, the three cultural agencies awarded 79 grants in Washington DC, investing $7,025,064 in the district and the US National Capital.
66 grants from NEA totaling $3,945,323
13 grants from NEH totaling $1,709,370
5 grants from IMLS totaling $1,370,371
Geographic Reach
84 grants to 1 metropolitan area
Population Insights
Total state population – 687,324
In 2023, the Federal cultural investment was $10.22 per person in the district.
(This figure does not include investment per person nationally.)
Washington DC Representation (District of Columbia)
In 2023-2024, the three agencies (NEA, NEH and IMLS) awarded grants in the District of Columbia, represented by a non-voting delegate.
If you would like a detailed list of grants awarded in this district, please email keren@usregionalarts.org.
62 grants from NEA totaling $4,438,865
21 grants from NEH totaling $3,277,993
13 grants from IMLS totaling $4,897,993
Geographic Reach
96 grants to 1 metropolitan area
Population Insights
Total district population – 702,250
In 2024, the Federal cultural investment was $17.96 per person in the district.
(This figure does not include investment per person nationally.)
Washington DC Representation
In 2023-2024, the three agencies (NEA, NEH and IMLS) awarded grants in the District of Columbia, represented by a non-voting delegate.
If you would like a detailed list of grants awarded by district, please email keren@usregionalarts.org.
36 grants from NEA totaling $3,475,395
48 grants from NEH totaling $5,979,114
4 grants from IMLS totaling $15,634,924
Geographic Reach
88 grants to 1 metropolitan areas
Population Insights
Total district population – 693,645
In 2025, the Federal cultural investment was $36.17 per person in the district.
(This figure does not include investment per person nationally.)
Washington DC Representation
In 2025, the three agencies (NEA, NEH and IMLS) awarded grants in the District of Columbia, represented by a non-voting delegate.
If you would like a detailed list of grants for this district, please email keren@usregionalarts.org.
1 grant from NEA totaling $370,280
1 grant from NEH totaling $51,296
Geographic Reach
2 grants to 1 rural area
Population Insights
Total population – 104,917
In 2023, the Federal cultural investment was $4.02 per person.
US Virgin Islands Representation
In 2023-2024, the three agencies (NEA, NEH and IMLS) awarded grants in the territory of the U.S. Virgin Islands, represented by a non-voting delegate.
If you would like a detailed list of grants awarded in this territory, please email keren@usregionalarts.org.
1 grant from NEA totaling $375,150
1 grant from NEH totaling $96,787
1 grant from IMLS totaling $139,393
Geographic Reach
3 grants to 1 rural area
Population Insights
Total population – 104,377
In 2024, the Federal cultural investment was $5.86 per person.
US Virgin Islands Representation
In 2023-2024, the three agencies (NEA, NEH and IMLS) awarded grants in the territory of the US Virgin Islands, represented by a non-voting delegate.
If you would like a detailed list of grants awarded in this territory, please email keren@usregionalarts.org.
1 grant from NEA totaling $375,315
1 grant from NEH totaling $205,473
1 grant from IMLS totaling $138,706
Geographic Reach
3 grants to 1 micropolitan area
Population Insights
Total territory population – 84,138
In 2025, the Federal cultural investment was $8.55 per person.
US Virgin Islands Representation
In 2025, the three agencies (NEA, NEH and IMLS) awarded grants in the territory of the US Virgin Islands, represented by a non-voting delegate.
If you would like a detailed list of grants for this territory, please email keren@usregionalarts.org.
642 grants from NEA totaling $17,799,992
103 grants from NEH totaling $16,001,201
54 grants from IMLS totaling $18,742,026
Geographic Reach
764 grants to 79 metropolitan areas
21 grants to 15 micropolitan areas
14 grants to 10 rural areas
Population Insights
Total state population – 19,737,367
In 2023, the Federal cultural investment was $2.66 per person.
New York Congressional Districts
In 2023-2024, the three agencies (NEA, NEH and IMLS) awarded grants in 100% of the US Congressional Districts (26 of 26 districts) in New York.
If you would like a detailed list of grants awarded by district, please email keren@usregionalarts.org.
569 grants from NEA totaling $19,086,049
102 grants from NEH totaling $14,411,721
57 grants from IMLS totaling $18,543,779
Geographic Reach
700 grants to 79 metropolitan areas
18 grants to 10 micropolitan areas
10 grants to 8 rural areas
Population Insights
Total state population – 19,867,248
In 2024, the Federal cultural investment was $2.62 per person.
New York Congressional Districts
In 2023-2024, the three agencies (NEA, NEH and IMLS) awarded grants in 100% of the US Congressional Districts (26 of 26 districts) in New York.
If you would like a detailed list of grants awarded by district, please email keren@usregionalarts.org.
226 grants from NEA totaling $7,589,198
177 grants from NEH totaling $35,613,232
10 grants from IMLS totaling $9,694,972
Geographic Reach
377 grants to 44 metropolitan areas
21 grants to 14 micropolitan areas
15 grants to 13 rural areas
Population Insights
Total state population – 20,002,427
In 2025, the Federal cultural investment was $2.64 per person.
New York Congressional Districts
In 2025, the three agencies (NEA, NEH and IMLS) awarded grants in 100% of the US Congressional Districts (26 of 26) in New York.
If you would like a detailed list of grants by district, please email keren@usregionalarts.org.
113 grants from NEA totaling $3,630,807
40 grants from NEH totaling $4,288,731
19 grants from IMLS totaling $4,579,564
Geographic Reach
165 grants to 34 metropolitan areas
4 grants to 3 micropolitan areas
3 grants to 3 rural areas
Population Insights
Total state population – 13,017,721
In 2023, the Federal cultural investment was $0.96 per person.
Pennsylvania Congressional Districts
In 2023-2024, the three agencies (NEA, NEH and IMLS) awarded grants in 100% of the US Congressional Districts (17 of 17districts) in Pennsylvania.
If you would like a detailed list of grants awarded by district, please email keren@usregionalarts.org.
91 grants from NEA totaling $3,692,000
42 grants from NEH totaling $5,108,114
19 grants from IMLS totaling $10,458,652
Geographic Reach
147 grants to 28 metropolitan areas
2 grants to 1 micropolitan area
3 grants to 3 rural areas
Population Insights
Total state population – 13,078,751
In 2024, the Federal cultural investment was $1.47 per person.
Pennsylvania Congressional Districts
In 2023-2024, the three agencies (NEA, NEH and IMLS) awarded grants in 100% of the US Congressional Districts (17 of 17 districts) in Pennsylvania.
If you would like a detailed list of grants awarded by district, please email keren@usregionalarts.org.
44 grants from NEA totaling $2,494,538
94 grants from NEH totaling $12,051,410
11 grants from IMLS totaling $8,263,218
Geographic Reach
126 grants to 32 metropolitan areas
11 grants to 9 micropolitan areas
12 grants to 7 rural areas
Population Insights
Total state population – 13,059,432
In 2025, the Federal cultural investment was $1.75 per person.
Pennsylvania Congressional Districts
In 2025, the three agencies (NEA, NEH and IMLS) awarded grants in 100% of the US Congressional Districts (17 of 17) in Pennsylvania.
If you would like a detailed list of grants by district, please email keren@usregionalarts.org.
8 grants from NEA totaling $1,109,400
4 grants from NEH totaling $501,021
1 grants from IMLS totaling $50,000
Geographic Reach
10 grants to 5 metropolitan areas
1 grant to 1 micropolitan area
2 grants to 2 rural areas
Population Insights
Total state population – 1,770,495
In 2023, the Federal cultural investment was $0.94 per person
West Virginia Congressional Districts
In 2023-2024, the three agencies (NEA, NEH and IMLS) awarded grants in 100% of the US Congressional Districts (2 of 2 districts) in West Virginia.
If you would like a detailed list of grants awarded by district, please email keren@usregionalarts.org.
10 grants from NEA totaling $1,176,881
2 grants from NEH totaling $155,574
2 grants from IMLS totaling $1,926,236
Geographic Reach
10 grants to 5 metropolitan areas
2 grants to 2 micropolitan areas
2 grants to 1 rural area
Population Insights
Total state population – 1,769,979
In 2024, the Federal cultural investment was $1.84 per person.
West Virginia Congressional Districts
In 2023-2024, the three agencies (NEA, NEH and IMLS) awarded grants in 100% of the US Congressional Districts (2 of 2 districts) in West Virginia.
If you would like a detailed list of grants awarded by district, please email keren@usregionalarts.org.
3 grants from NEA totaling $1,088,838
3 grants from NEH totaling $3057,50
1 grant from IMLS totaling $1,596,414
Geographic Reach
3 grants to 1 metropolitan area
2 grants to 2 micropolitan areas
2 grants to 1 rural area
Population Insights
Total state population – 1,766,147
In 2025, the Federal cultural investment was $1.69 per person.
West Virginia Congressional Districts
In 2025, the three agencies (NEA, NEH and IMLS) awarded grants in 100% of the US Congressional Districts (2 of 2) in West Virginia.
If you would like a detailed list of grants by district, please email keren@usregionalarts.org.
45 grants from NEA totaling $2,051,978
45 grants from NEH totaling $4,020,466
17 grants from IMLS totaling $8,507,352
Geographic Reach
102 grants to 25 metropolitan areas
5 grants to 4 rural areas
Population Insights
Total population – 8,734,685
In 2023, the Federal cultural investment was $1.67 per person.
Virginia Congressional Districts
In 2023-2024, the three agencies (NEA, NEH and IMLS) awarded grants in 100% of the US Congressional Districts (11 of 11 districts) in Virginia.
If you would like a detailed list of grants awarded by district, please email keren@usregionalarts.org.
41 grants from NEA totaling $2,084,830
30 grants from NEH totaling $5,391,355
22 grants from IMLS totaling $9,768,903
Geographic Reach
90 grants to 26 metropolitan areas
1 grant to 1 micropolitan area
2 grants to 2 rural areas
Population Insights
Total state population – 8,811,195
In 2024, the Federal cultural investment was $1.96 per person.
Virginia Congressional Districts
In 2023-2024, the three agencies (NEA, NEH and IMLS) awarded grants in 100% of the US Congressional Districts (11 of 11 districts) in Virginia.
If you would like a detailed list of grants awarded by district, please email keren@usregionalarts.org.
23 grants from NEA totaling $1,682,568
69 grants from NEH totaling $20,723,575
5 grants from IMLS totaling $5,419,259
Geographic Reach
89 grants to 21 metropolitan areas
3 grants to 2 micropolitan areas
5 grants to 5 rural areas
Population Insights
Total state population – 8,880,107
In 2025, the Federal cultural investment was $3.13 per person.
Virginia Congressional Districts
In 2025, the three agencies (NEA, NEH and IMLS) awarded grants in 91% of the US Congressional Districts (10 of 11) in Virginia.
If you would like a detailed list of grants by district, please email keren@usregionalarts.org.
7 grants from NEA totaling $1,080,000
5 grants from NEH totaling $142,784
Geographic Reach
12 grants to 4 metropolitan areas
Population Insights
Total state population – 1,036,423
In 2023, the Federal cultural investment was $1.18 per person.
Delaware Congressional Districts
In 2023-2024, the three agencies (NEA, NEH and IMLS) awarded grants in 100% of the US Congressional Districts (1 of 1 district) in Delaware.
If you would like a detailed list of grants awarded by district, please email keren@usregionalarts.org.
7 grants from NEA totaling $1,060,000
2 grants from NEH totaling $748,446
4 grants from IMLS totaling $1,510,181
Geographic Reach
13 grants to 3 metropolitan areas
Population Insights
Total state population – 1,051,917
In 2024, the Federal cultural investment was $3.15 per person.
Delaware Congressional Districts
In 2023-2024, the three agencies (NEA, NEH and IMLS) awarded grants in 100% of the US Congressional Districts (1 of 1 district) in Delaware.
If you would like a detailed list of grants awarded by district, please email keren@usregionalarts.org.
4 grants from NEA totaling $1,130,795
7 grants from NEH totaling $1,230,236
2 grants from IMLS totaling $1,735,753
Geographic Reach
13 grants to 6 metropolitan areas
Population Insights
Total state population – 1,059,952
In 2025, the Federal cultural investment was $3.87 per person.
Delaware Congressional Districts
In 2025, the three agencies (NEA, NEH and IMLS) awarded grants in 100% of the US Congressional Districts (1 of 1) in Delaware.
If you would like a detailed list of grants by district, please email keren@usregionalarts.org.
40 grants from NEA totaling $2,139,232
23 grants from NEH totaling $2,729,072
3 grants from IMLS totaling $1,008,588
Geographic Reach
66 grants to 36 metropolitan areas
Population Insights
Total state population – 9,379,642
In 2023, the Federal cultural investment was $0.63 per person.
New Jersey Congressional Districts
In 2023-2024, the three agencies (NEA, NEH and IMLS) awarded grants in 100% of the US Congressional Districts (12 of 12 districts) in New Jersey.
If you would like a detailed list of grants awarded by district, please email keren@usregionalarts.org.
38 grants from NEA totaling $2,374,200
15 grants from NEH totaling $1,311,754
6 grants from IMLS totaling $4,987,323
Geographic Reach
59 grants to 33 metropolitan areas
Population Insights
Total state population – 9,500,851
In 2024, the Federal cultural investment was $0.91 per person.
New Jersey Congressional Districts
In 2023-2024, the three agencies (NEA, NEH and IMLS) awarded grants in 100% of the US Congressional Districts (12 of 12 districts) in New Jersey.
If you would like a detailed list of grants awarded by district, please email keren@usregionalarts.org.
15 grants from NEA totaling $1,772,538
35 grants from NEH totaling $3,304,542
5 grants from IMLS totaling $5,527,291
Geographic Reach
55 grants to 28 metropolitan areas
Population Insights
Total state population – 9,548,215
In 2025, the Federal cultural investment was $1.11 per person.
New Jersey Congressional Districts
In 2025, the three agencies (NEA, NEH and IMLS) awarded grants in 83% of the US Congressional Districts (10 of 12) in New Jersey.
If you would like a detailed list of grants by district, please email keren@usregionalarts.org.
45 grants from NEA totaling $4,078,135
26 grants from NEH totaling $1,758,322
7 grants from IMLS totaling $991,412
Geographic Reach
76 grants to 24 metropolitan areas
2 grants to 2 rural areas
Population Insights
Total state population – 6,217,062
In 2023, the Federal cultural investment was $1.10 per person.
Maryland Congressional Districts
In 2023-2024, the three agencies (NEA, NEH and IMLS) awarded grants in 100% of the US Congressional Districts (8 of 8 districts) in Maryland.
If you would like a detailed list of grants awarded by district, please email keren@usregionalarts.org.
44 grants from NEA totaling $4,355,500
12 grants from NEH totaling $1,025,173
14 grants from IMLS totaling $5,890,931
Geographic Reach
68 grants to 20 metropolitan areas
1 grant to 1 micropolitan area
1 grant to 1 rural area
Population Insights
Total state population – 6,263,220
In 2024, the Federal cultural investment was $1.80 per person.
Maryland Congressional Districts
In 2023-2024, the three agencies (NEA, NEH and IMLS) awarded grants in 100% of the US Congressional Districts (8 of 8 districts) in Maryland.
If you would like a detailed list of grants awarded by district, please email keren@usregionalarts.org.
28 grants from NEA totaling $3,857,638
29 grants from NEH totaling $2,973,169
4 grants from IMLS totaling $3,719,340
Geographic Reach
58 grants to 17 metropolitan areas
2 grants to 2 micropolitan areas
1 grant to 1 rural area
Population Insights
Total state population – 6,265,347
In 2025, the Federal cultural investment was $1.68 per person.
Maryland Congressional Districts
In 2025, the three agencies (NEA, NEH and IMLS) awarded grants in 100% of the US Congressional Districts (8 of 8) in Maryland.
If you would like a detailed list of grants by district, please email keren@usregionalarts.org.
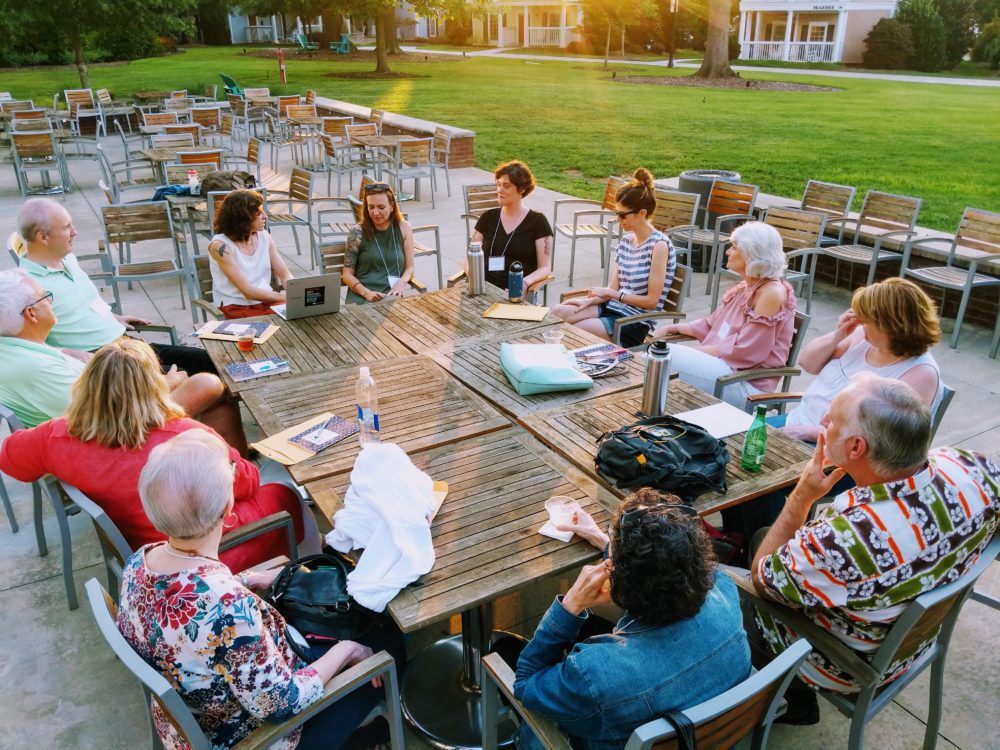
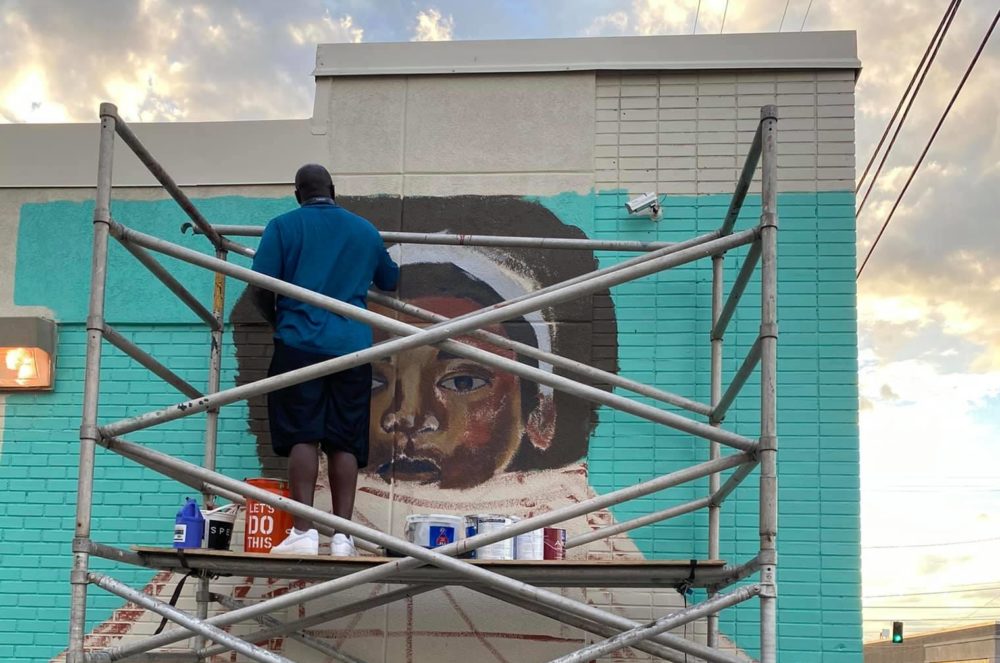
310 grants from NEA totaling $18,906,548
130 grants from NEH totaling $13,843,984
64 grants from IMLS totaling $30,533,034
Geographic Reach
457 grants to 116 metropolitan areas
32 grants to 22 micropolitan areas
15 grants to 10 rural areas
Population insights
Total region population – 74,586,134
In 2023, the average Federal cultural investment was $.91 per person in the Southern region.
South Arts’ Congressional Districts
In 2023, the three cultural agencies awarded grants in 94% of the US Congressional Districts (89 of 95 districts) in the Southern region.
273 grants from NEA totaling $19,743,640
89 grants from NEH totaling $10,450,414
66 grants from IMLS totaling $44,984,001
Geographic Reach
394 grants to 115 metropolitan areas
25 grants to 19 micropolitan areas
9 grants to 8 rural areas
Population insights
Total region population – 75,592,554
In 2024, the average Federal cultural investment was $1.09 per person in the Southern region.
South Arts’ Congressional Districts
In 2024, the three cultural agencies awarded grants in 86% of the US Congressional Districts (82 of 95 districts) in the Southern region.
148 grants from NEA totaling $16,915,542
179 grants from NEH totaling $25,096,947
74 grants from IMLS totaling $47,743,321
Geographic Reach
354 grants to 93 metropolitan areas
31 grants to 24 micropolitan areas
16 grants to 14 rural areas
Population Insights
Total state population – 76,220,885
In 2025, the Federal cultural investment was $1.18 per person.
South Arts’ Congressional Districts
In 2025, the three agencies (NEA, NEH and IMLS) awarded grants in 84% of the US Congressional Districts (80 of 95) in the Southern region.
If you would like a detailed list of grants by district, please email keren@usregionalarts.org.
22 grants from NEA totaling $1,552,125
8 grants from NEH totaling $1,002,302
no grants from IMLS
Geographic Reach
28 grants to 10 metropolitan areas
1 grant to 1 micropolitan area
1 grant to 1 rural area
Population Insights
Total state population – 5,117,673
In 2023, the Federal cultural investment was $0.50 per person.
Alabama Congressional Districts
In 2023-2024, the three agencies (NEA, NEH and IMLS) awarded grants in 100% of the US Congressional Districts (7 of 7 districts) in Alabama.
If you would like a detailed list of grants awarded by district, please email keren@usregionalarts.org.
19 grants from NEA totaling $1,614,215
6 grants from NEH totaling $705,769
3 grants from IMLS totaling $359,876
Geographic Reach
28 grants to 11 metropolitan areas
Population Insights
Total state population – 5,157,699
In 2024, the Federal cultural investment was $0.52 per person.
Alabama Congressional Districts
In 2023-2024, the three agencies (NEA, NEH and IMLS) awarded grants in 100% of the US Congressional Districts (7 of 7 districts) in Alabama.
If you would like a detailed list of grants awarded by district, please email keren@usregionalarts.org.
6 grants from NEA totaling $1,235,538
12 grants from NEH totaling $1,015,761
7 grants from IMLS totaling $3,541,253
Geographic Reach
22 grants to 7 metropolitan areas
2 grants to 2 micropolitan areas
1 grant to 1 rural area
Population Insights
Total state population – 5,193,088
In 2025, the Federal cultural investment was $1.12 per person.
Alabama Congressional Districts
In 2025, the three agencies (NEA, NEH and IMLS) awarded grants in 100% of the US Congressional Districts (7 of 7) in Alabama.
If you would like a detailed list of grants by district, please email keren@usregionalarts.org.
80 grants from NEA totaling $3,083,247
19 grants from NEH totaling $1,727,885
13 grants from IMLS totaling $10,230,529
Geographic Reach
112 grants to 39metropolitan areas
Population Insights
Total state population – 22,904,868
In 2023, the Federal cultural investment was $0.66 per person.
Florida Congressional Districts
In 2023-2024, the three agencies (NEA, NEH and IMLS) awarded grants in 96% of the US Congressional Districts 27 of 28 districts) in Florida.
If you would like a detailed list of grants awarded by district, please email keren@usregionalarts.org.
71 grants from NEA totaling $3,106,520
19 grants from NEH totaling $1,302,508
12 grants from IMLS totaling $11,427,660
Geographic Reach
102 grants to 34 metropolitan areas
Population Insights
Total state population – 23,372,215
In 2024, the Federal cultural investment was $0.68 per person.
Florida Congressional Districts
In 2023-2024, the three agencies (NEA, NEH and IMLS) awarded grants in 96% of the US Congressional Districts 27 of 28 districts) in Florida.
If you would like a detailed list of grants awarded by district, please email keren@usregionalarts.org.
37 grants from NEA totaling $2,570,663
31 grants from NEH totaling $2,191,008
20 grants from IMLS totaling $13,636,814
Geographic Reach
87 grants to 30 metropolitan areas
1 grant to 1 rural area
Population Insights
Total state population – 23,462,518
In 2025, the Federal cultural investment was $0.78 per person.
Florida Congressional Districts
In 2025, the three agencies (NEA, NEH and IMLS) awarded grants in 68% of the US Congressional Districts (19 of 28) in Florida.
If you would like a detailed list of grants by district, please email keren@usregionalarts.org.
39 grants from NEA totaling $2,276,343
12 grants from NEH totaling $1,572,640
6 grants from IMLS totaling $3,807,767
Geographic Reach
53 grants to 6 metropolitan areas
4 grants to 3 micropolitan areas
Population Insights
Total state population – 4,588,071
In 2023, the Federal cultural investment was $1.67 per person.
Louisiana Congressional Districts
In 2023-2024, the three agencies (NEA, NEH and IMLS) awarded grants in 100% of the US Congressional Districts (6 of 6 districts) in Louisiana.
If you would like a detailed list of grants awarded by district, please email keren@usregionalarts.org.
27 grants from NEA totaling $1,914,900
4 grants from NEH totaling $258,696
6 grants from IMLS totaling $3,533,146
Geographic Reach
34 grants to 7 metropolitan areas
2 grants to 2 micropolitan areas
1 grant to 1 rural area
Population Insights
Total state population – 4,597,740
In 2024, the Federal cultural investment was $1.24 per person.
Louisiana Congressional Districts
In 2023-2024, the three agencies (NEA, NEH and IMLS) awarded grants in 100% of the US Congressional Districts (6 of 6 districts) in Louisiana.
If you would like a detailed list of grants awarded by district, please email keren@usregionalarts.org.
14 grants from NEA totaling $1,669,038
11 grants from NEH totaling $1,015,204
12 grants from IMLS totaling $4,586,689
Geographic Reach
34 grants to 6 metropolitan areas
2 grants to 2 micropolitan areas
1 grant to 1 rural area
Population Insights
Total state population – 4,618,189
In 2025, the Federal cultural investment was $1.57 per person.
Louisiana Congressional Districts
In 2025, the three agencies (NEA, NEH and IMLS) awarded grants in 100% of the US Congressional Districts (6 of 6) in Louisiana.
If you would like a detailed list of grants by district, please email keren@usregionalarts.org.
36 grants from NEA totaling $1,750,400
13 grants from NEH totaling $2,233,761
4 grants from IMLS totaling $999,560
Geographic Reach
53 grants to 11 metropolitan areas
Population Insights
Total state population – 7,148,304
In 2023, the Federal cultural investment was $0.70 per person.
Tennessee Congressional Districts
In 2023-2024, the three agencies (NEA, NEH and IMLS) awarded grants in 100% of the US Congressional Districts (9 of 9 districts) in Tennessee.
If you would like a detailed list of grants awarded by district, please email keren@usregionalarts.org
35 grants from NEA totaling $1,841,250
14 grants from NEH totaling $1,259,203
7 grants from IMLS totaling $4,675,317
Geographic Reach
56 grants to 11 metropolitan areas
Population Insights
Total state population – 7,227,750
In 2024, the Federal cultural investment was $1.08 per person.
Tennessee Congressional Districts
In 2023-2024, the three agencies (NEA, NEH and IMLS) awarded grants in 100% of the US Congressional Districts (9 of 9 districts) in Tennessee.
If you would like a detailed list of grants awarded by district, please email keren@usregionalarts.org.
19 grants from NEA totaling $1,660,423
27 grants from NEH totaling $9,657,010
4 grants from IMLS totaling $4,096,183
Geographic Reach
49 grants to 10 metropolitan areas
1 grant to 1 micropolitan area
Population Insights
Total state population – 7,315,076
In 2025, the Federal cultural investment was $2.11 per person.
Tennessee Congressional Districts
In 2025, the three agencies (NEA, NEH and IMLS) awarded grants in 100% of the US Congressional Districts (9 of 9) in Tennessee.
If you would like a detailed list of grants by district, please email keren@usregionalarts.org.
4 grants from NEA totaling $1,114,500
8 grants from NEH totaling $761,178
1 grant from IMLS totaling $156,000
Geographic Reach
8 grants to 3 metropolitan areas
4 grants to 4 micropolitan areas
1 grant to 1 rural area
Population Insights
Total state population – 2,943,172
In 2023, the Federal cultural investment was $0.69 per person.
Mississippi Congressional Districts
In 2023-2024, the three agencies (NEA, NEH and IMLS) awarded grants in 100% of the US Congressional Districts (4 of 4 districts) in Mississippi.
If you would like a detailed list of grants awarded by district, please email keren@usregionalarts.org.
10 grants from NEA totaling $1,314,500
3 grants from NEH totaling $65,697
2 grants from IMLS totaling $2,159,457
Geographic Reach
6 grants to 2 metropolitan areas
9 grants to 6 micropolitan areas
Population Insights
Total state population – 2,943,045
In 2024, the Federal cultural investment was $1.20 per person.
Mississippi Congressional Districts
In 2023-2024, the three agencies (NEA, NEH and IMLS) awarded grants in 100% of the US Congressional Districts (4 of 4 districts) in Mississippi.
If you would like a detailed list of grants awarded by district, please email keren@usregionalarts.org.
4 grants from NEA totaling $1,184,838
7 grants from NEH totaling $699,280
5 grants from IMLS totaling $2,688,468
Geographic Reach
7 grants to 3 metropolitan areas
9 grants to 6 micropolitan areas
Population Insights
Total state population – 2,954,160
In 2025, the Federal cultural investment was $1.55 per person.
Mississippi Congressional Districts
In 2025, the three agencies (NEA, NEH and IMLS) awarded grants in 100% of the US Congressional Districts (4 of 4) in Mississippi.
If you would like a detailed list of grants by district, please email keren@usregionalarts.org.
12 grants from NEA totaling $1,317,400
7 grants from NEH totaling $313,618
8 grants from IMLS totaling $1,332,192
Geographic Reach
26 grants to 12 metropolitan areas
1 grant to 1 micropolitan area
Population Insights
Total state population – 5,387,830
In 2023, the Federal cultural investment was $0.55 per person.
South Carolina Congressional Districts
In 2023-2024, the three agencies (NEA, NEH and IMLS) awarded grants in 100% of the US Congressional Districts (7 of 7 districts) in South Carolina.
If you would like a detailed list of grants awarded by district, please email keren@usregionalarts.org.
16 grants from NEA totaling $1,532,000
6 grants from NEH totaling $860,677
11 grants from IMLS totaling $5,600,449
Geographic Reach
33 grants to 10 metropolitan areas
Population Insights
Total state population – 5,478,831
In 2024, the Federal cultural investment was $1.46 per person.
South Carolina Congressional Districts
In 2023-2024, the three agencies (NEA, NEH and IMLS) awarded grants in 100% of the US Congressional Districts (7 of 7 districts) in South Carolina.
If you would like a detailed list of grants awarded by district, please email keren@usregionalarts.org.
14 grants from NEA totaling $1,556,438
13 grants from NEH totaling $1,255,115
10 grants from IMLS totaling $3,934,583
Geographic Reach
28 grants to 7 metropolitan areas
7 grants to 4 micropolitan areas
2 grants to 2 rural areas
Population Insights
Total state population – 5,570,274
In 2025, the Federal cultural investment was $1.21 per person.
South Carolina Congressional Districts
In 2025, the three agencies (NEA, NEH and IMLS) awarded grants in 86% of the US Congressional Districts (6 of 7) in South Carolina.
If you would like a detailed list of grants by district, please email keren@usregionalarts.org.
28 grants from NEA totaling $1,520,299
13 grants from NEH totaling $797,276
9 grants from IMLS totaling $4,658,332
Geographic Reach
33 grants to 7 metropolitan areas
11 grants to 4 micropolitan areas
6 grants to 1 rural area
Population Insights
Total state population – 4,550,595
In 2023, the Federal cultural investment was $1.53 per person.
Kentucky Congressional Districts
In 2023-2024, the three agencies (NEA, NEH and IMLS) awarded grants in 100% of the US Congressional Districts (6 of 6 districts) in Kentucky.
If you would like a detailed list of grants awarded by district, please email keren@usregionalarts.org.
19 grants from NEA totaling $1,717,530
6 grants from NEH totaling $832,457
7 grants from IMLS totaling $3,932,974
Geographic Reach
21 grants to 4 metropolitan areas
8 grants to 6 micropolitan areas
3 grants to 2 rural areas
Population Insights
Total state population – 4,588,372
In 2024, the Federal cultural investment was $1.41 per person.
Kentucky Congressional Districts
In 2023-2024, the three agencies (NEA, NEH and IMLS) awarded grants in 100% of the US Congressional Districts (6 of 6 districts) in Kentucky.
If you would like a detailed list of grants awarded by district, please email keren@usregionalarts.org.
14 grants from NEA totaling $1,482,783
9 grants from NEH totaling $971,227
4 grants from IMLS totaling $3,404,906
Geographic Reach
17 grants to 3 metropolitan areas
5 grants to 4 micropolitan areas
5 grants to 3 rural areas
Population Insights
Total state population – 4,606,864
In 2025, the Federal cultural investment was $1.27 per person.
Kentucky Congressional Districts
In 2025, the three agencies (NEA, NEH and IMLS) awarded grants in 83% of the US Congressional Districts (5 of 6) in Kentucky.
If you would like a detailed list of grants by district, please email keren@usregionalarts.org.
46 grants from NEA totaling $2,317,252
31 grants from NEH totaling $3,448,466
14 grants from IMLS totaling $2,227,322
Geographic Reach
78 grants to 15 metropolitan areas
7 grants to 5 micropolitan areas
6 grants to 6 rural areas
Population Insights
Total state population – 10,881,189
In 2023, the Federal cultural investment was $0.73 per person.
North Carolina Congressional Districts
In 2023-2024, the three agencies (NEA, NEH and IMLS) awarded grants in 100% of the US Congressional Districts (14 of 14 districts) in North Carolina.
If you would like a detailed list of grants awarded by district, please email keren@usregionalarts.org.
37 grants from NEA totaling $2,518,400
12 grants from NEH totaling $2,565,060
13 grants from IMLS totaling $7,201,688
Geographic Reach
57 grants to 23 metropolitan areas
1 grant to 1 micropolitan area
4 grants to 4 rural areas
Population Insights
Total state population – 11,046,024
In 2024, the Federal cultural investment was $1.11 per person.
North Carolina Congressional Districts
In 2023-2024, the three agencies (NEA, NEH and IMLS) awarded grants in 100% of the US Congressional Districts (14 of 14 districts) in North Carolina.
If you would like a detailed list of grants awarded by district, please email keren@usregionalarts.org.
18 grants from NEA totaling $1,936,538
34 grants from NEH totaling $3,980,806
5 grants from IMLS totaling $5,691,788
Geographic Reach
52 grants to 16 metropolitan areas
2 grants to 2 micropolitan areas
3 grants to 3 rural areas
Population Insights
Total state population – 11,197,968
In 2025, the Federal cultural investment was $1.04 per person.
North Carolina Congressional Districts
In 2025, the three agencies (NEA, NEH and IMLS) awarded grants in 86% of the US Congressional Districts (12 of 14) in North Carolina.
If you would like a detailed list of grants by district, please email keren@usregionalarts.org.
43 grants from NEA totaling $3,974,982
19 grants from NEH totaling $1,986,858
9 grants from IMLS totaling $7,121,332
Geographic Reach
66 grants to 13 metropolitan areas
4 grants to 4 micropolitan areas
1 grant to 1 rural area
Population Insights
Total state population – 11,064,432
In 2023, the Federal cultural investment was $1.18 per person.
Georgia Congressional Districts
In 2023-2024, the three agencies (NEA, NEH and IMLS) awarded grants in 93% of the US Congressional Districts (13 of 14 districts) in Georgia.
If you would like a detailed list of grants awarded by district, please email keren@usregionalarts.org.
39 grants from NEA totaling $4,184,325
19 grants from NEH totaling $2,600,347
5 grants from IMLS totaling $6,093,434
Geographic Reach
57 grants to 13 metropolitan areas
5 grants to 4 micropolitan areas
1 grant to 1 rural area
Population Insights
Total state population – 11,180,878
In 2024, the Federal cultural investment was $1.15 per person.
Georgia Congressional Districts
In 2023-2024, the three agencies (NEA, NEH and IMLS) awarded grants in 93% of the US Congressional Districts (13 of 14 districts) in Georgia.
If you would like a detailed list of grants awarded by district, please email keren@usregionalarts.org.
22 grants from NEA totaling $3,619,283
35 grants from NEH totaling $4,311,536
7 grants from IMLS totaling $6,162,637
Geographic Reach
58 grants to 11 metropolitan areas
3 grants to 3 micropolitan areas
3 grants to 3 rural areas
Population Insights
Total state population – 11,302,748
In 2025, the Federal cultural investment was $1.25 per person.
Georgia Congressional Districts
In 2025, the three agencies (NEA, NEH and IMLS) awarded grants in 86% of the US Congressional Districts (12 of 14) in Georgia.
If you would like a detailed list of grants by district, please email keren@usregionalarts.org.
National Endowment for the Arts (NEA) 2025 Annual Budget = $207,000,000
National Endowment for the Humanities (NEH) 2025 Annual Budget = $207,000,000
Institute of Museum and Library Services (IMLS) 2025 Annual Budget = $294,800,000
TOTAL = $708,800,00
US 2025 Total Budget = $7.01 Trillion
Percent of Federal dollars spent on arts and culture agencies = 0.001%
Why Public Support for Arts and Culture Matters–especially in rural areas
According to the NEA, “A recent review of arts funding of the top 1,000 private and community foundations found that they don’t reach 65 percent of the counties in the country. In contrast, the Arts Endowment funds projects that reach 779 more counties than private foundations—that’s a quarter of the counties in the United States!” Federal funding ensures that all parts of our country–even those far removed from private philanthropy, have access to arts support that contributes to their community’s vibrancy and well-being.
NEA funding is a critical backbone of support that leverages state and local investment in the arts. For decades, the NEA has awarded 40% of its grantmaking budget to State Arts Agencies (SAAs) and Regional Arts Organizations (RAOs) for local re-granting, which in turn leverages matching government and private dollars. These funds often go to smaller, more rural communities that do not receive federal or private funding. SAA and RAO re-grant distribution data is not yet included in this report.
Federal funds are awarded to each RAO, with collective impact across the entire region through re-granting. Each state receives federal funds, and the federal/state matching funds are also re-granted to organizations statewide.
Data included in this report uses the following definitions of communities by population type, based on this document published by the U.S. Census Bureau.